Appendix D — educabr2: An R Package for Long-Run Brazilian Education Data
D.1 Introduction
A central challenge in the historical study of education systems, particularly in developing nations like Brazil, is the reconciliation of highly heterogeneous data sources. Across the twentieth and early twenty-first centuries, official statistics on school enrollments, educational attainment, and public spending have been collected under varying administrative regimes, survey methodologies, and institutional classifications. In Brazil, researchers attempting to build long-run historical series must manually scrape and harmonize data from the IBGE’s twentieth-century compilations, distinct ministries, the National Household Survey (PNAD), and various waves of the Higher Education Census (Censup) managed by the National Institute for Educational Studies and Research (INEP).
Each researcher typically reconstructs these series independently, recreating harmonization decisions, resolving data breaks, and writing custom scripts to bridge historical gaps. This siloed approach introduces duplicate effort, reduces comparability across studies, and hampers reproducibility. The educabr2 R package was developed to address this infrastructure gap. It provides a curated, tidy, and documented database of long-run Brazilian education series, accessible through a simple and consistent functional API.
Designed as a public research infrastructure tool, educabr2 draws inspiration from — while remaining far more modest in scope and contribution than — the design philosophy established by other prominent Brazilian data packages, such as censobr for population census data (Pereira & Barbosa, 2026a) and geobr for spatial data (Pereira & Barbosa, 2026b). By offering a single, tidy-long schema with explicit, row-level provenance, the package shifts the burden of data cleaning from the individual researcher to a shared, auditable, and version-controlled codebase.
Over the past two decades, contemporary microdata became increasingly accessible. Education researchers could use household surveys, census records, and even administrative microdata that follow individual students from the moment they enter the system, and a researcher studying the 2010s can assemble a dataset faster than ever before, without special computational power. Enrollment counts, attainment stocks, and spending figures before the 1990s, however, until not so long ago survived only in static yearbook tables, ministry reports, and commemorative compilations, few of them mutually consistent. The reconstructions that do exist document the terrain’s difficulty: the Anuário Estatístico do Brasil did not report enrollments by state, forcing recourse to scattered Ministry of Education reports from 1959, 1974, 1977, and 1985; national enrollment figures are simply missing for 1988–1990 and 1994; and the 1971 education law (Lei 5.692) reorganized the grade structure itself, so that even the categories being counted changed beneath the series (Kang et al., 2021). The practical consequence is a literature in which most studies perform one-off, largely unsystematic archival collections (often illustrative, selecting a single year per decade), with each researcher redoing the harmonization work in isolation, frequently without visibility into why one reconstructed series diverges from another.
Concretely, the package covers enrollment, attainment, spending, grade progression, and international comparison, with every harmonization decision recorded at the level of the individual row, and it stands on the shoulders of two archival traditions it seeks to make durable. The first is the series of compilations by the economic historian Thomas H. Kang and coauthors, who reconstructed enrollment and retention (1933–2010), public spending by education level (1933–2010), and, with Walter, average years of schooling (1925–2015) from yearbooks, ministry reports, and census microdata (Kang et al., 2021, 2024; Kang & Menetrier, 2024; Walter & Kang, 2024). The second is the historical series assembled by Rogério Barbosa in his doctoral work from the IBGE’s Estatísticas do Século XX and the historical yearbooks, which traces higher-education enrollment back to the 5,795 students registered in 1907 (Barbosa, 2018) — and whose author suggested, in conversation, that this scattered patrimony deserved to live in an R package rather than in appendix tables. educabr2 unifies these foundations, extends them with the detailed official registers that begin in the 1990s (INEP synopses, CENSUP microdata, official dashboards), and resolves their overlaps through an explicit deduplication hierarchy.
In doing so, the package joins a lineage of dataset papers that has recently consolidated in the social sciences: publications whose contribution is not a new estimate but a new, documented, reusable measurement infrastructure. Internationally, the construction of cross-national historical education datasets has become a research program in its own right — the EPSM dataset codes de jure education policies for 145 countries from 1789 to 2020 (Del Río et al., 2025b), and its builders have distilled explicit methodological lessons about transparency in historical data collection: document coding thresholds and assumptions, record the sources behind every observation, triangulate when primary and secondary sources diverge, and expose rather than average away the disagreements (Del Río et al., 2025a). Domestically, censobr (Pereira & Barbosa, 2026a) and geobr (Pereira & Barbosa, 2026b) established the model of the Brazilian data package as public research infrastructure, published and peer-reviewed as such. educabr2 follows both templates deliberately (its source_note column, validation section, and preserved source overlaps below are direct applications of the transparency guidelines), while remaining more modest in scale: not a census, but a century of education statistics made queryable.
D.2 Why Long-Run Education Data Matter
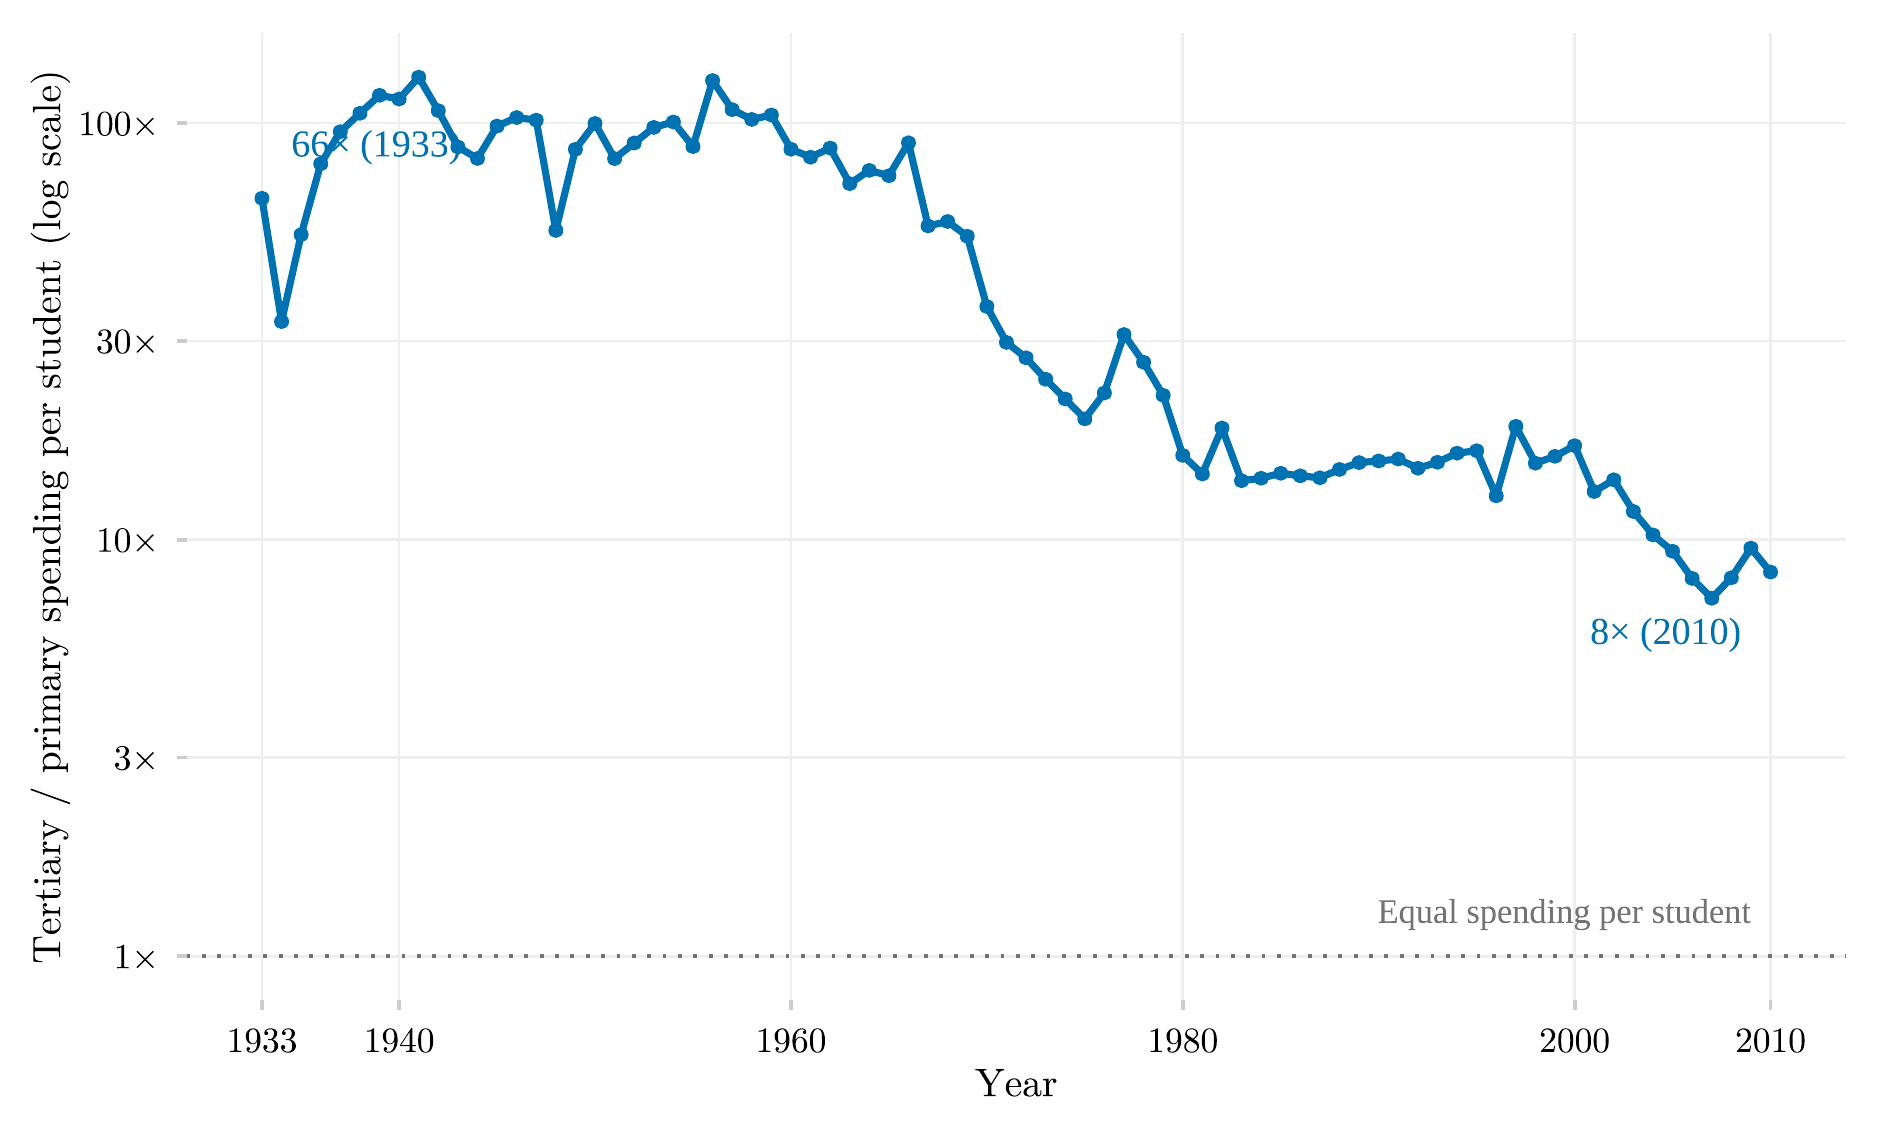
The demand for such series is not antiquarian. The political economy of education has learned that the deep history of educational expansion is a live theoretical battleground, and that the data to fight on it must reach far beyond the survey era. Paglayan (2022), assembling an original panel of primary enrollment rates for 40 European and Latin American countries from 1828 to 2015, showed that mass primary schooling typically expanded before democratization, and accelerated after episodes of internal violence: experiencing a civil war raised subsequent primary enrollment by about 11 percentage points relative to a prewar mean of 20 percent, a pattern she reads as state-building through indoctrination (education provided by autocracies and oligarchies “to indoctrinate the masses to accept their societal role, obey the law, and fear the consequences of challenging authority”) rather than as a redistributive concession of democracies (Paglayan, 2022, 2024). Whatever one’s position in that debate, it cannot even be joined for a given country without long, harmonized national series — precisely what Brazil has lacked in analytic form. The Brazilian record that educabr2 systematizes speaks directly to this agenda: Kang & Menetrier (2024) document that public education spending was historically low and skewed toward the elites (spending per tertiary student stood at dozens of times the level per primary pupil through the mid-century, an “elitist educational policy” in their terms, operationalized through the double-ratio indicator in the tradition of Lindert), at a time when roughly a third of the population was illiterate. The dissertation’s own questions about the redistributive politics of tertiary expansion are one instance of this research program; the package was built so that the next instance does not have to begin in the archives.
D.3 The Regulatory History Behind the Breaks
A distinctive premise of educabr2 is that the breaks and asymmetries in Brazilian education statistics are not accidents of record-keeping: they are, to a large extent, regulatory events, and harmonizing the series requires knowing the law. Two clusters of rules shape the tertiary panel in particular. The first is the 1997 regulation of the private sector under the 1996 education law (LDB, Lei 9.394/1996). Decree 2,207 of 15 April 1997 first classified higher-education institutions by legal nature and subjected for-profit mantenedoras to commercial law — the moment for-profit higher education became a formal administrative category in Brazil; it was replaced within months by Decree 2,306 of 19 August 1997, issued under Provisional Measure 1,477-39 of 8 August 1997 (which regulated tuition charges and created the centro universitário as an institutional type). Everything the package reports about the for-profit versus non-profit composition of private enrollment, and about the university/university-center/faculty typology, descends from categories these instruments created; the data can only carry such breakdowns consistently from the years in which the official registers began recording them (systematically from 2009–2010).
The second cluster concerns distance education (EAD). Article 80 of the LDB authorized it in 1996; Decree 2,494 of 10 February 1998 provided the first regulation; and Decree 5,622 of 19 December 2005 replaced that framework with the accreditation regime (including the polos de apoio presencial) under which large-scale private distance education actually expanded. The statistical apparatus lagged the regulation: between 2000 and 2008, INEP collected EAD enrollment in a separate CENSUP table and did not add it to the published headline totals, so that every standard series for that decade systematically undercounts enrollment — the problem addressed by the package’s reconstructed totals (Section D.8, Example B). From 2009, the redesigned registry integrates both modalities. The general point carries beyond these two episodes: where a series breaks, the package’s documentation names the legal or administrative event behind the break, because a user who mistakes a regulatory discontinuity for an empirical trend will draw the wrong substantive conclusion.
D.5 Installation and Setup
Following the established standards of modern R data packages, educabr2 is designed to be easily installable and fully integrated into the standard R scientific workflow. The package is hosted on GitHub and can be installed directly into any R session.
D.5.1 Installing Package Dependencies
To install and load the package from its development repository, users first need to install the devtools package (or remotes) from CRAN. In addition, since educabr2 conforms to the tidyverse ecosystem by returning standard, clean tibbles, installing the tidyverse suite (which includes dplyr and ggplot2) is highly recommended for downstream data analysis and visualization:
# Install devtools for GitHub package installation
install.packages("devtools")

# Install tidyverse for data manipulation and plotting
install.packages("tidyverse")
D.5.2 Installing educabr2
Once the dependencies are installed, educabr2 can be compiled and installed directly from GitHub using the following command:
# Install educabr2 from the official GitHub repository
devtools::install_github("mancano-tales/educabr2")
D.5.3 Verifying the Installation
To verify that the package is correctly installed and ready for use, you can load the library and call the source discovery function. This function queries the internal package manifest and displays all available historical datasets:
library(educabr2)

# List all harmonized data sources bundled in the package
list_sources()
If the function returns a clean tibble listing the package’s sources (such as Maduro Junior, Durham, and INEP), your installation is successful and the database is ready to be queried.
D.6 Brazilian Higher Education Census Data: Sources and Breaks
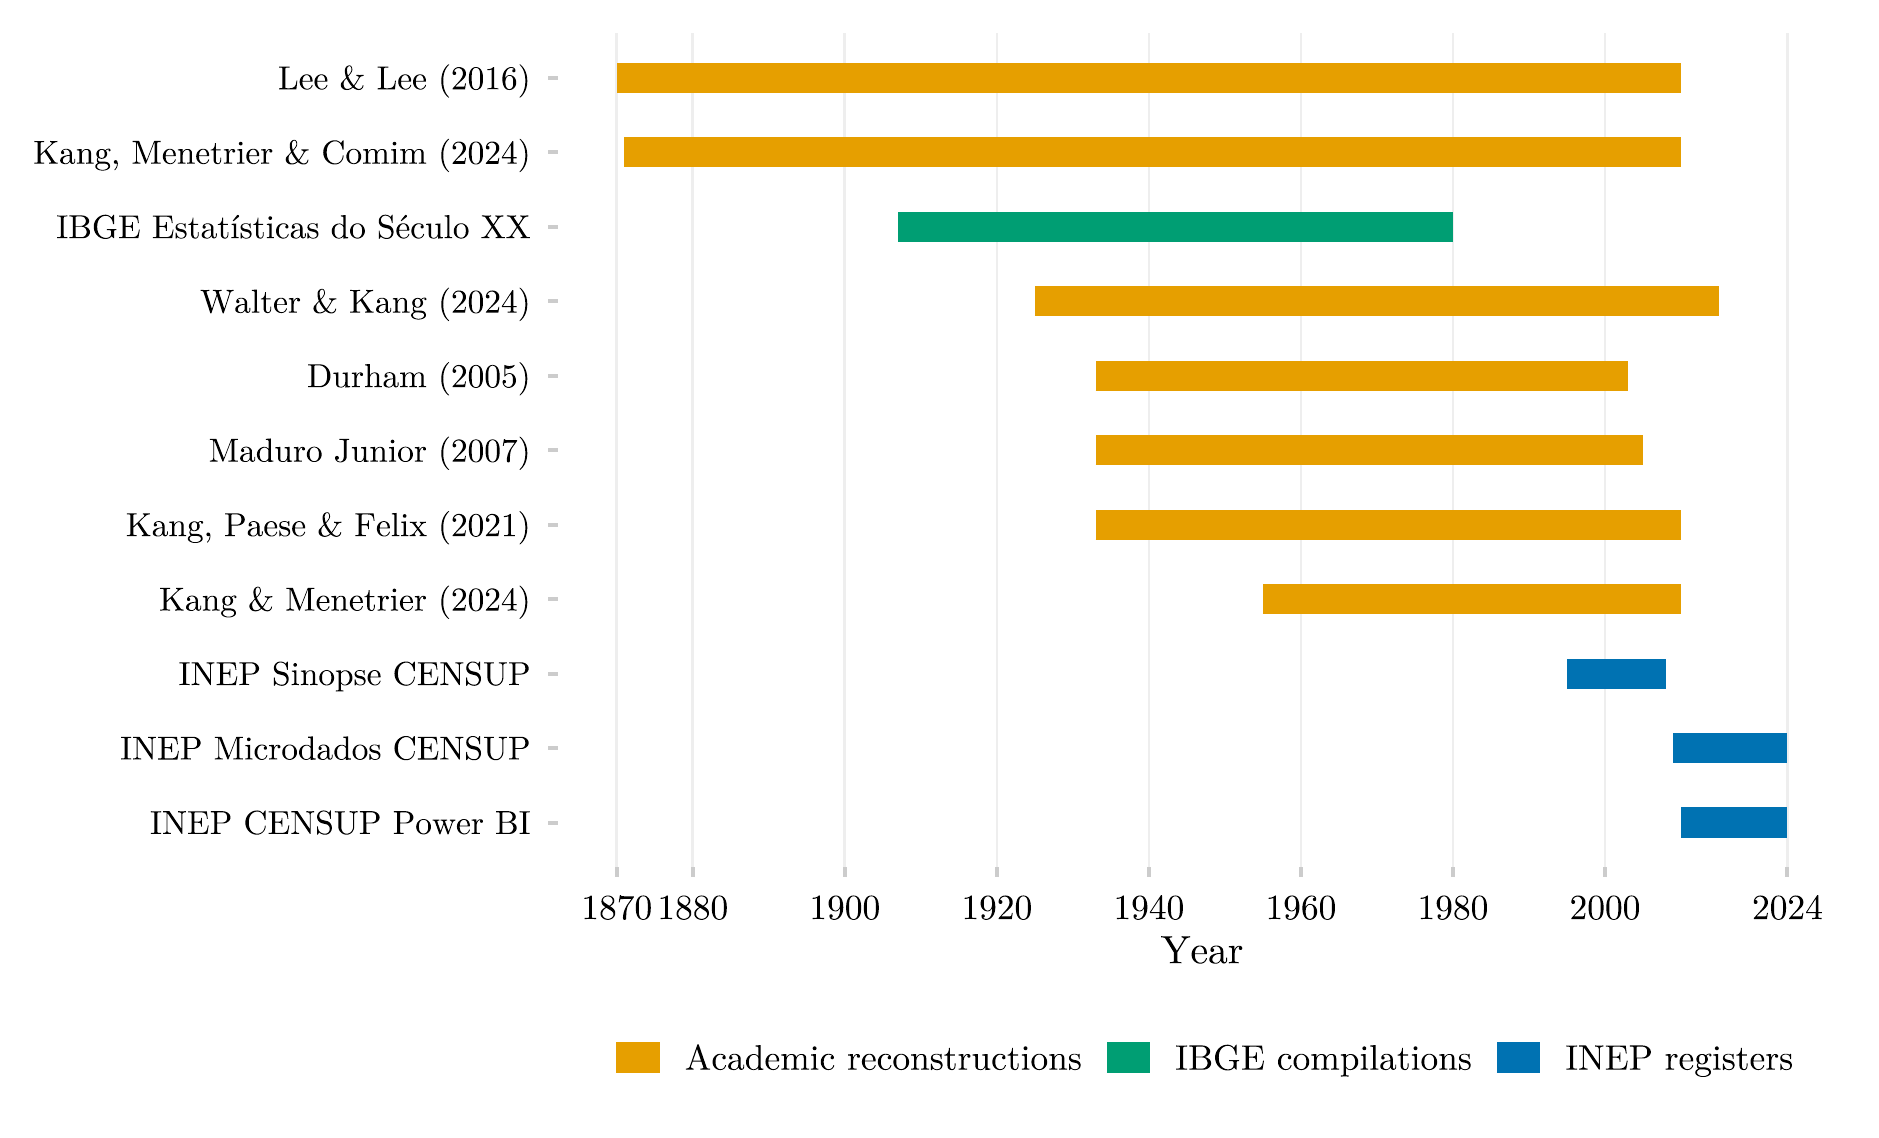
The reconstruction of higher education enrollments in Brazil requires synthesizing data across multiple historical eras, each dominated by different primary sources. For the early twentieth century (1907–1932), data is drawn from IBGE’s historical compilations, notably the Estatísticas do Século XX (IBGE, 2007), which gathered early administrative records. For the long period of expansion spanning the developmentalist decades and the military dictatorship (1933–1994), the series relies on academic reconstructions by Durham (2005), Maduro Júnior (2007), and Kang et al. (2021), which bridged gaps in current official Ministry of Education records with archival work from early sources not currently organized formally by any official agency. From 1995 to 2008, INEP published aggregated reports under the Sinopse Estatística da Educação Superior; and from 2009 to 2024, individual- and course-level registry data is compiled from the Censo da Educação Superior microdata and its official dashboards.
A core contribution of educabr2 is its implementation of a strict deduplication hierarchy to merge these competing sources into a single continuous panel. When the same year and administrative sector are covered by multiple databases, the package prioritizes the most disaggregated and official source available, in the following order of precedence: INEP CensoSup microdata (2009–2024), then the INEP statistical synopses (1995–2008), then the reconstruction by Kang, Paese, and Felix (2021) for 1990–1994, then Maduro Junior (2007), then Durham (2005), and finally the IBGE Estatísticas do Século XX (IBGE, 2007). This hierarchy resolves overlaps while preserving the historical depth of the series. However, it also exposes major structural breaks. For example, detailed breakdowns of private institutions (such as for-profit vs. non-profit) and teaching modality (in-person vs. distance learning, or EAD) are only available consistently starting in 2009. Prior to that, in-person and distance enrollments were often tracked in separate tables, leading to systemic underreporting in consolidated historical series.
Figure D.1 summarizes the resulting division of labor visually: no single source covers the century, and the package’s reason to exist is precisely the harmonization of these overlapping, partial series.
D.7 Package API and Core Functions
The educabr2 package exposes a minimal, theme-based API designed for simplicity and consistency. Rather than organizing functions by original data source, the package organizes them by thematic inquiry (Table D.1).
educabr2 package.
| Function | What it returns |
|---|---|
get_enrollment() |
Historical enrollment headcounts and gross rates across education levels (fundamental, secondary, tertiary) and administrative networks, with optional race/color breakdowns |
get_schooling() |
Average years of schooling of the population aged 15 to 64, at national, regional, and state levels, with sex and race breakdowns (Walter & Kang, 2024) |
get_expenditure() |
Public expenditure on education as a share of GDP and per student, alongside indicators of fiscal regressivity (Kang & Menetrier, 2024) |
get_progression() |
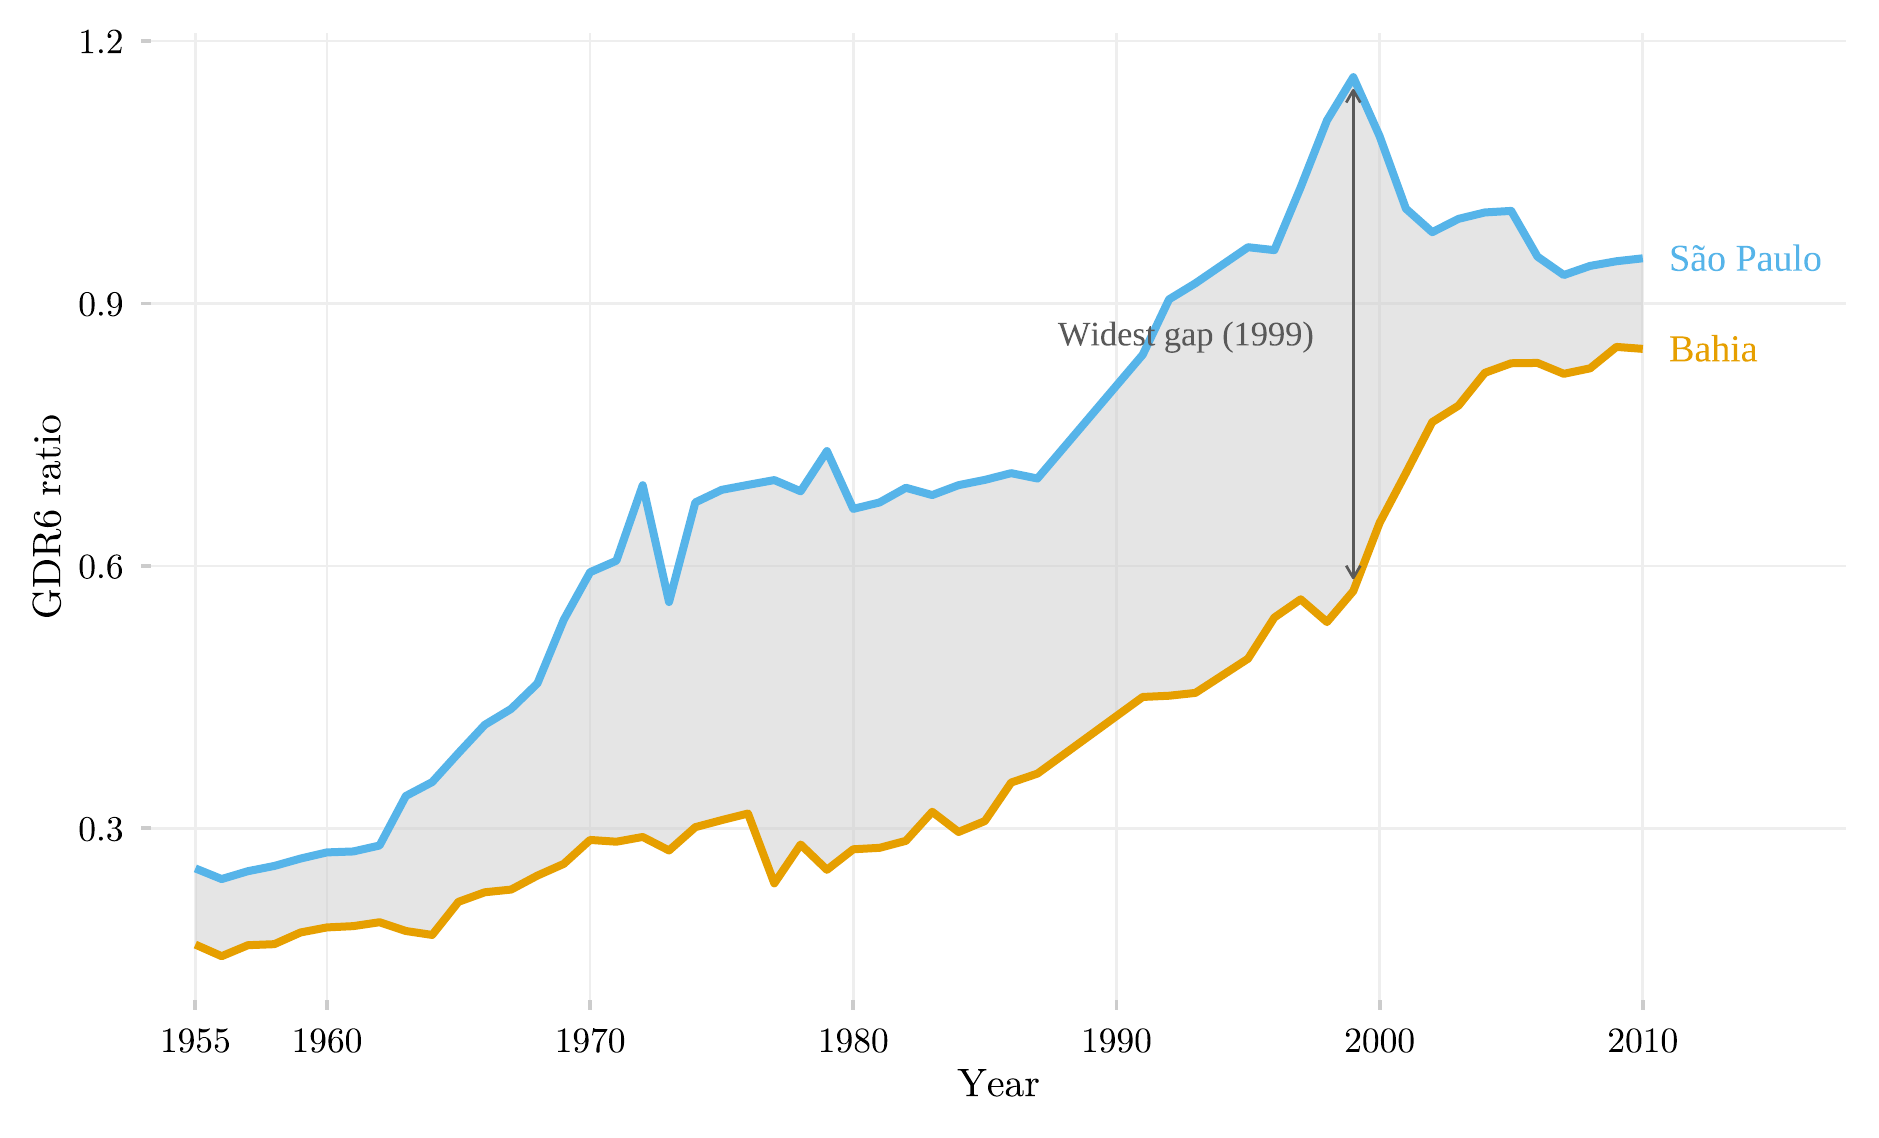
Grade-progression ratios, notably the GDR6 index (enrollment in grades 4–6 relative to grades 1–3) as a proxy for early primary retention (Kang et al., 2021) |
get_attainment() |
Comparative international educational attainment shares (Lee & Lee, 2016) |
list_sources() |
Catalogue of all bundled sources with descriptions, coverage, and citation details |
All data-access functions return a tibble in a canonical tidy-long format conforming to the controlled schema defined in inst/dict/schema.yaml. Shared arguments include year (to filter years), geo_level / geo (to restrict geography), source (to isolate a specific series), and lang (to translate factor levels and labels to Portuguese or English).
Behind this functional API, the package ships six internal datasets (Table D.2), lazy-loaded on demand. Together they hold roughly forty-one thousand harmonized observations spanning 1870 to 2024.
educabr2 (row counts from v0.1.0).
| Dataset | Coverage | Geography | Breakdowns | Rows | Compiled from |
|---|---|---|---|---|---|
enrollment_kang_fgv |
1871–2010 | Brazil; 20 states | Level (EF1, EF2, EM, tertiary); race (from 1960) | 6,238 | Kang et al. (2021); Kang & Menetrier (2024); Kang et al. (2024) |
enrollment_tertiary |
1907–2024 | Brazil | Administrative network; institution type; modality (in-person/EAD) | 1,341 | IBGE (2007); Durham (2005); Maduro Júnior (2007); Kang et al. (2021); INEP synopses, microdata and dashboards |
schooling_kang_fgv |
1925–2015 | Brazil; 5 macro-regions; states | Sex; race | 2,287 | Walter & Kang (2024) |
expenditure_kang_fgv |
1933–2010 | Brazil | Education level (per-level spending and double ratios) | 1,170 | Kang & Menetrier (2024) |
progression_kang_fgv |
1955–2010 | Brazil; 20 states | — | 1,090 | Kang et al. (2021) |
lee_lee_2016 |
1870–2010 | 111 countries | Sex; attainment level | 28,971 | Lee & Lee (2016) |
Two design conventions of the returned tables deserve explicit note, because they may otherwise puzzle users. First, the availability of the dimension argument is deliberately asymmetric across functions: get_schooling() accepts breakdowns by race and sex; get_enrollment() accepts race only (the underlying enrollment registers never recorded sex consistently); get_attainment() accepts sex only (Lee and Lee’s international dataset carries no race information); and get_expenditure() and get_progression() accept no breakdown at all. These asymmetries reproduce the physical limits of the historical sources, not limitations of the package code — a fact the documentation states explicitly so that researchers do not mistake a source constraint for a software bug. Second, functions whose sources carry no demographic breakdown still return the corresponding schema columns filled with constant values (for example, get_expenditure() returns dim_race = "total" and geo_level = "BR" on every row). These static columns are kept for schema compliance: because every function returns the same canonical column set, tables from different thematic functions can be stacked with a single bind_rows() call, without manual column padding.
A final architectural note situates the package in relation to its inspiration. Where censobr solves the problem of massive data (census microdata too large for memory) with on-demand downloads of Parquet files and lazy evaluation via Apache Arrow (Pereira & Barbosa, 2026a), educabr2 faces the opposite configuration: long-run aggregated series that are small (a few thousand rows per theme) but expensive to reconstruct. The appropriate architecture is therefore the inverse one — the harmonized tables are embedded directly in the package as compressed .rda files, so that a single installation delivers the complete database, offline, with no dependence on external servers or unstable government portals. The cost of this choice, a package a few hundred kilobytes larger, buys full reproducibility: an analysis script that ran against educabr2 v0.1.0 will produce identical numbers years from now, regardless of what happens to the INEP website.
D.8 Worked Examples and Visualizations
The following sections present concrete use cases demonstrating how educabr2 can be used to analyze historical trends and methodological issues in Brazilian education.
D.8.1 Example A: Long-Run Higher Education Enrollments
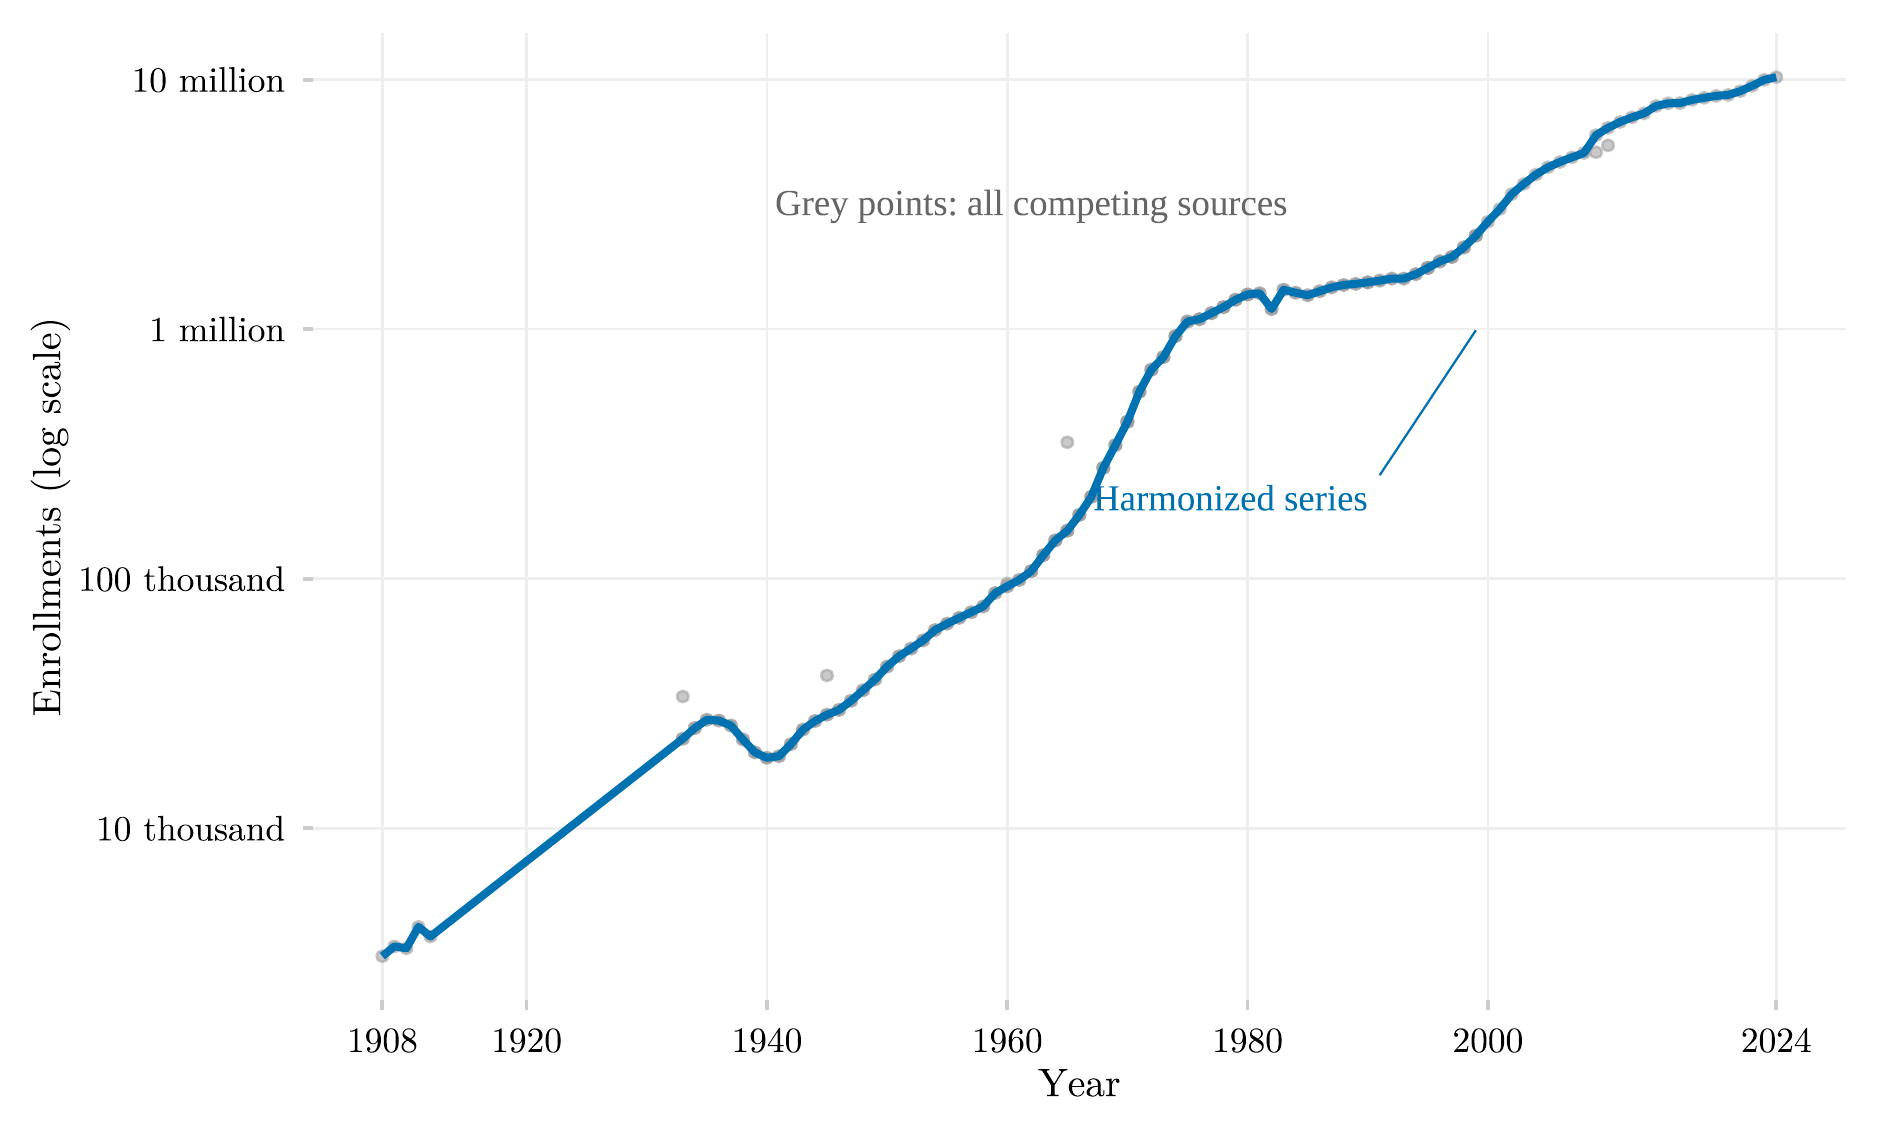
Using get_enrollment(), researchers can query and compare the entire historical series of tertiary enrollments across all competing sources in the literature. This comparison helps identify periods of convergence and methodological divergence:
library(educabr2)
library(dplyr)

# Query tertiary counts across all sources
es_data <- get_enrollment(
  level            = "superior",
  network          = "total",
  institution_type = "total",
  modality         = "total",
  indicator        = "count",
  lang             = "en"
)
The resulting comparison is plotted in Figure D.2: the highlighted line splices the six sources by the deduplication hierarchy, while the grey points preserve every competing estimate, so that cross-source agreement (and the few divergent stretches) can be read directly off the figure.
D.8.2 Example B: Reconstructed Totals and the EAD Underreport
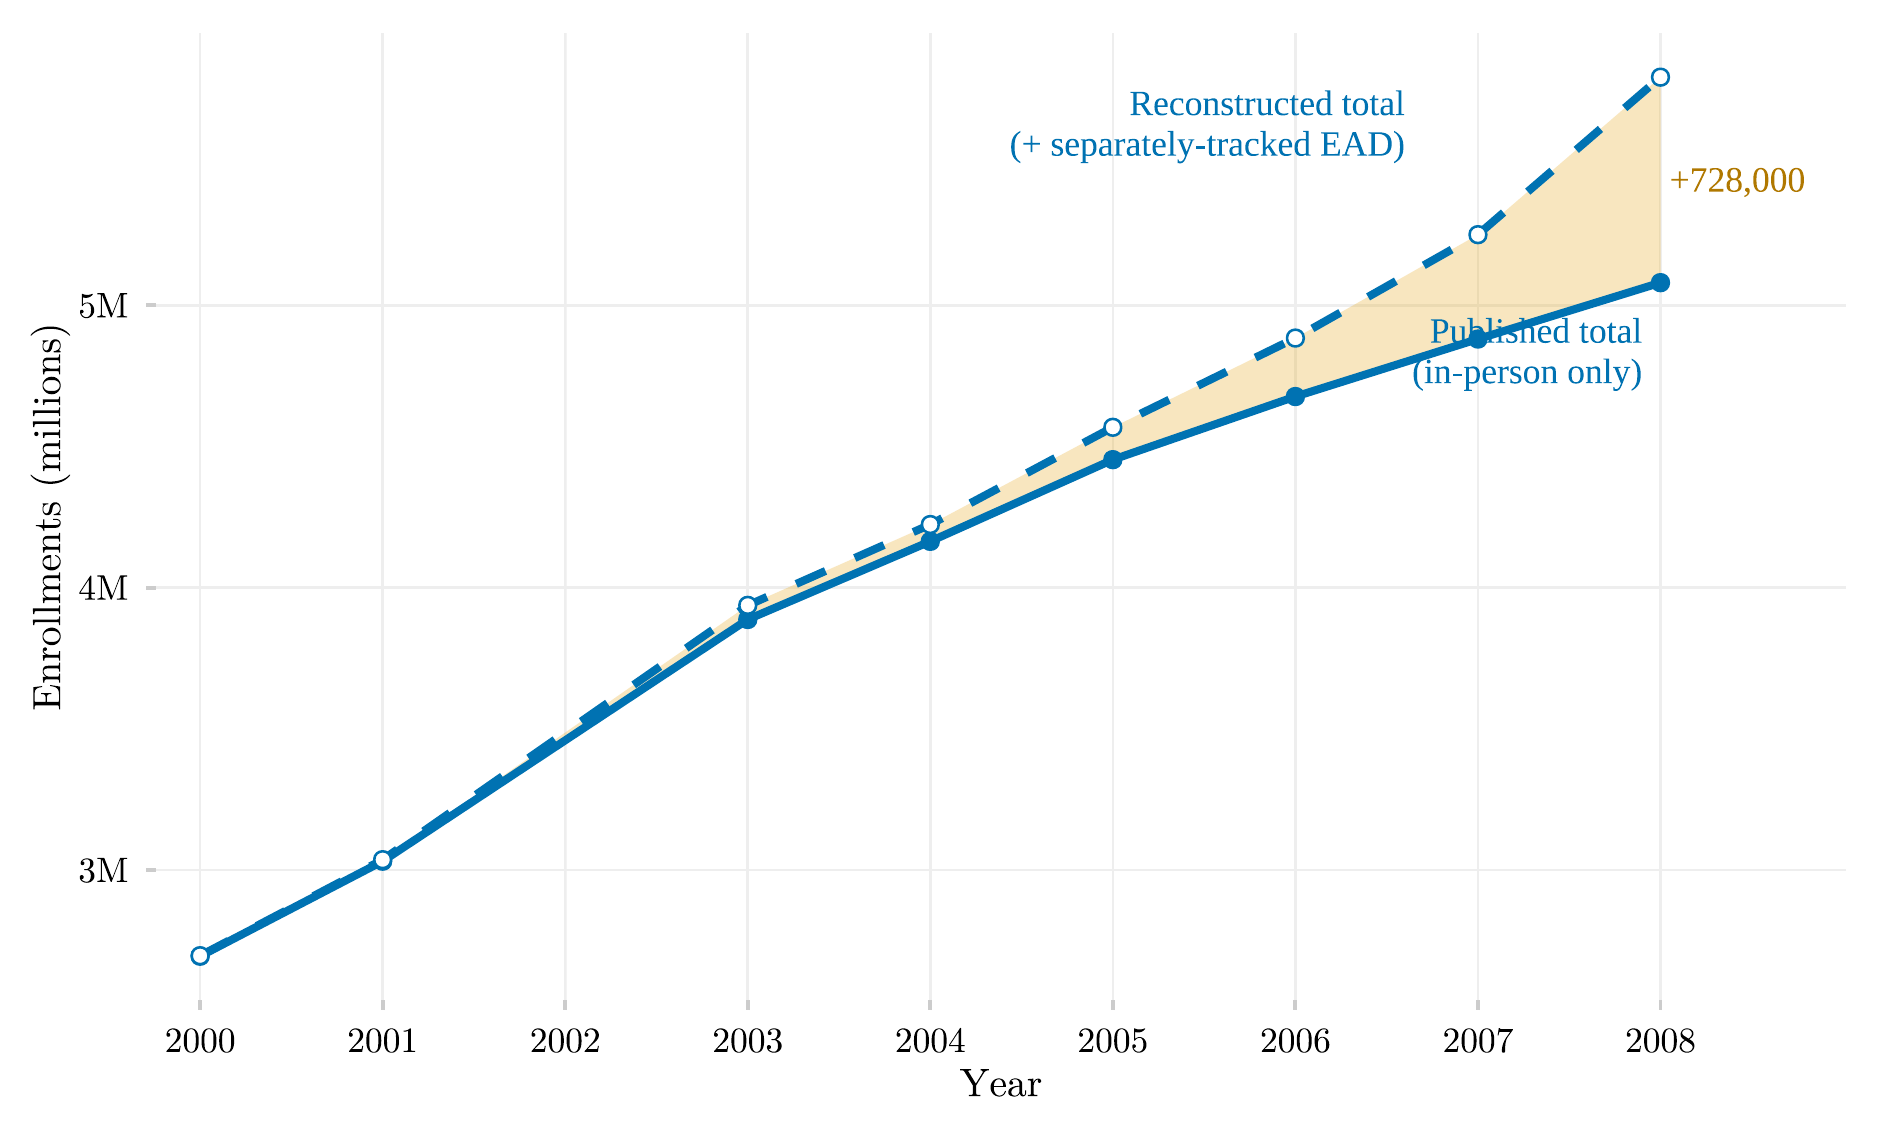
Between 2000 and 2008, INEP tracked distance learning (EAD) in a separate table (tabela7.x) but did not aggregate it into the headline “total” enrollment figures published in the primary CENSUP tables. Consequently, standard tertiary series published in academic papers and early INEP synopses systematically underreported enrollments.
To address this, educabr2 provides “reconstructed totals” (include_derived = TRUE) that combine the in-person series with the separate EAD counts for that transition decade. These composite rows carry the is_derived = TRUE flag:
# Retrieve original and reconstructed totals for the 2000-2008 transition
recon_data <- get_enrollment(
  level            = "superior",
  year             = c(2000, 2008),
  network          = "total",
  institution_type = "total",
  modality         = "total",
  indicator        = "count",
  include_derived  = TRUE,
  lang             = "en"
)
Figure D.3 makes the discrepancy visible: the shaded band between the published and reconstructed totals is the undercount itself, which grows to roughly 728,000 enrollments by 2008.
D.8.3 Example C: Educational Attainment by Sex
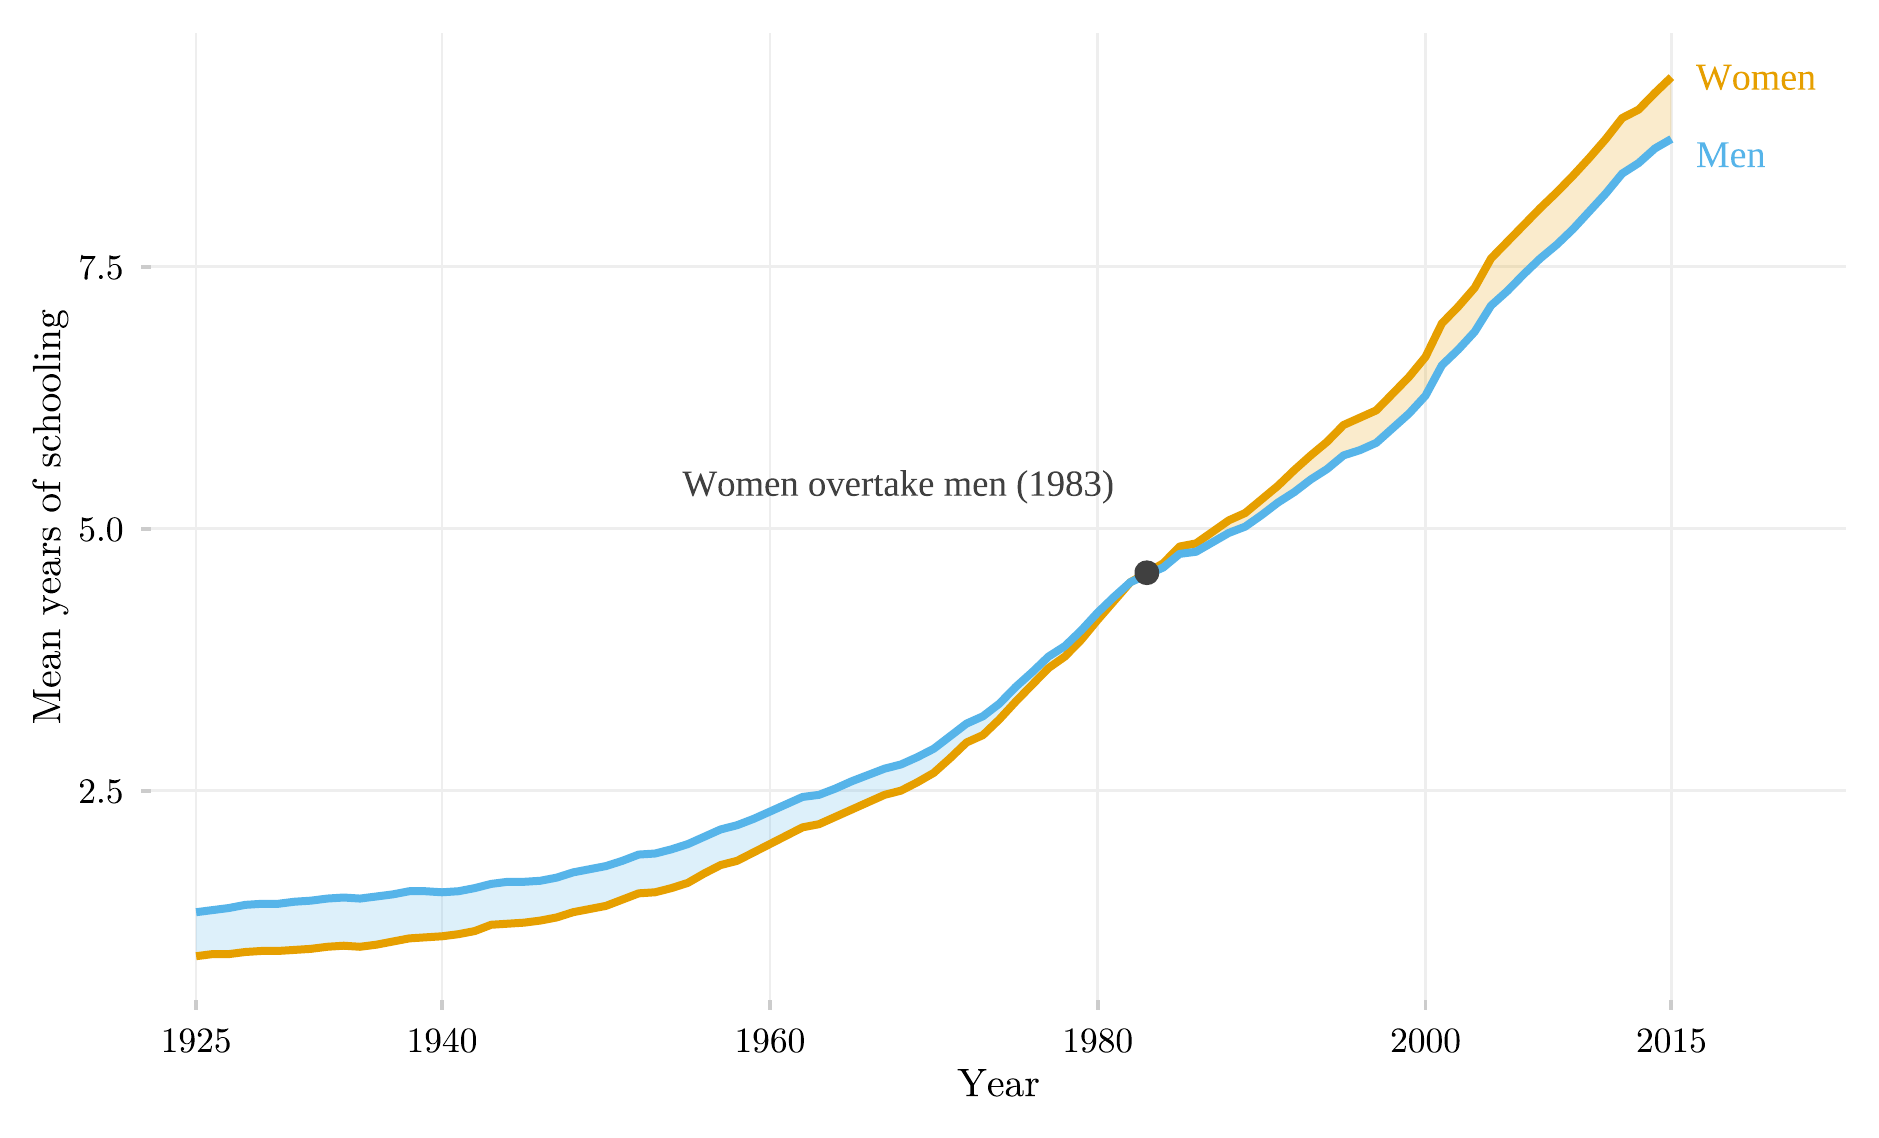
The package also exposes schooling stock data. Using get_schooling(dimension = "sex"), we can extract average years of schooling of the population aged 15 to 64 to analyze the historical closing and eventual reversal of the gender gap in educational attainment:
# Get average schooling years by sex
schooling_sex <- get_schooling(
  geo_level = "BR",
  dimension = "sex",
  lang      = "en"
)
The resulting series, compiled from Walter & Kang (2024), is shown in Figure D.4, tracing the trajectory from 1925 to 2015.
D.8.4 Example D: Fiscal Regressivity in Education Spending
To analyze the political economy of public expenditure, get_expenditure() provides access to indicators of fiscal regressivity, such as the double-ratio of per-student public spending in tertiary education relative to primary education (EF1):
# Retrieve the fiscal regressivity double ratio
regressivity <- get_expenditure(
  indicator = "double_ratio_es_ef1",
  lang      = "en"
)
Figure D.5 shows how the ratio evolved from 1933 to 2010.
D.8.5 Example E: Grade Progression (GDR6) across States
Finally, the get_progression() function allows researchers to analyze grade progression at the subnational level. GDR6 serves as a proxy for early primary retention (ratio of grades 4–6 to grades 1–3 of the old system). We compare the historical paths of São Paulo and Bahia in Figure D.6:
# Compare SP and BA progression ratios
prog_data <- get_progression(
  geo_level = "UF",
  geo       = c("SP", "BA"),
  lang      = "en"
)
D.9 Interactive Dashboard Manual
For researchers who prefer an interactive visual interface, educabr2 bundles a local Shiny dashboard, launched via:
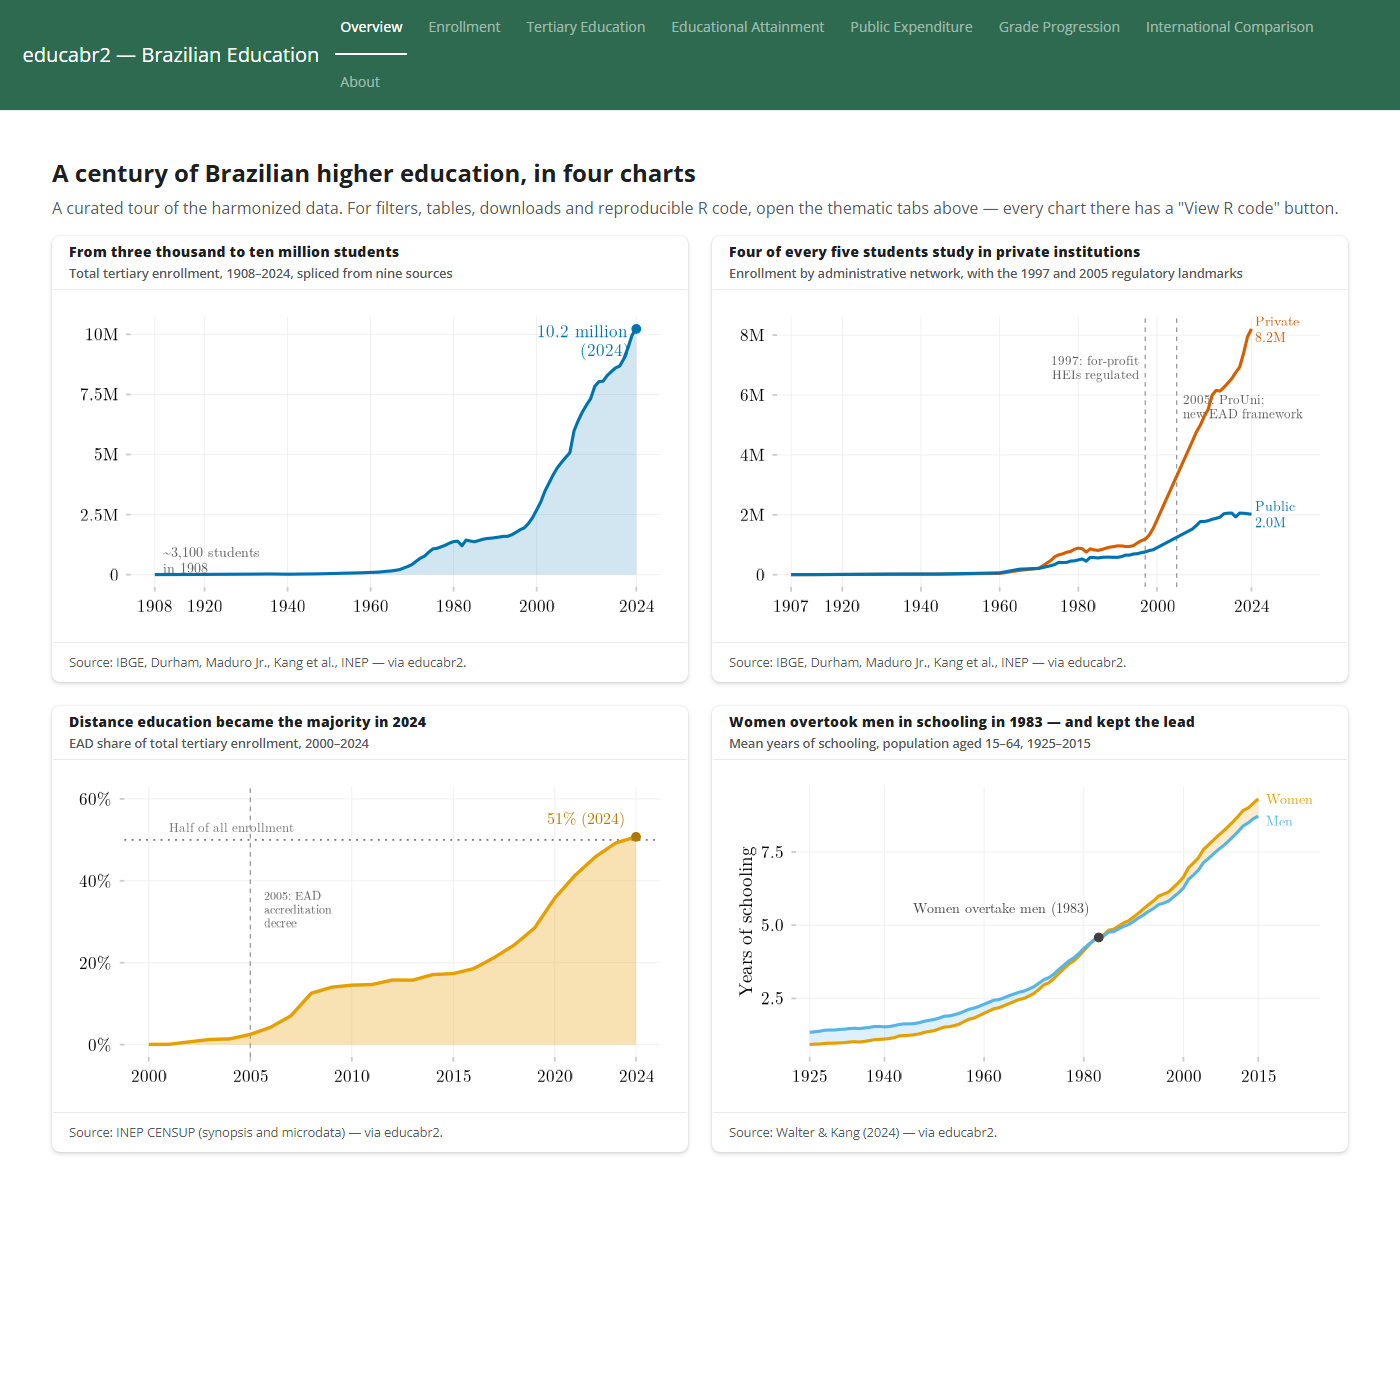
educabr2::run_dashboard()The dashboard opens on a curated Overview tab designed for non-technical audiences (Figure D.7): four fixed story charts, each stating its finding in an active title (the secular expansion from three thousand to ten million students; public versus private networks, with the 1997 and 2005 regulatory landmarks annotated; the rise of distance education to majority status in 2024; and the gender reversal in schooling), with direct line labels instead of legends and no controls. The exploratory apparatus lives in six thematic tabs, each wrapping one of the package’s core themes:
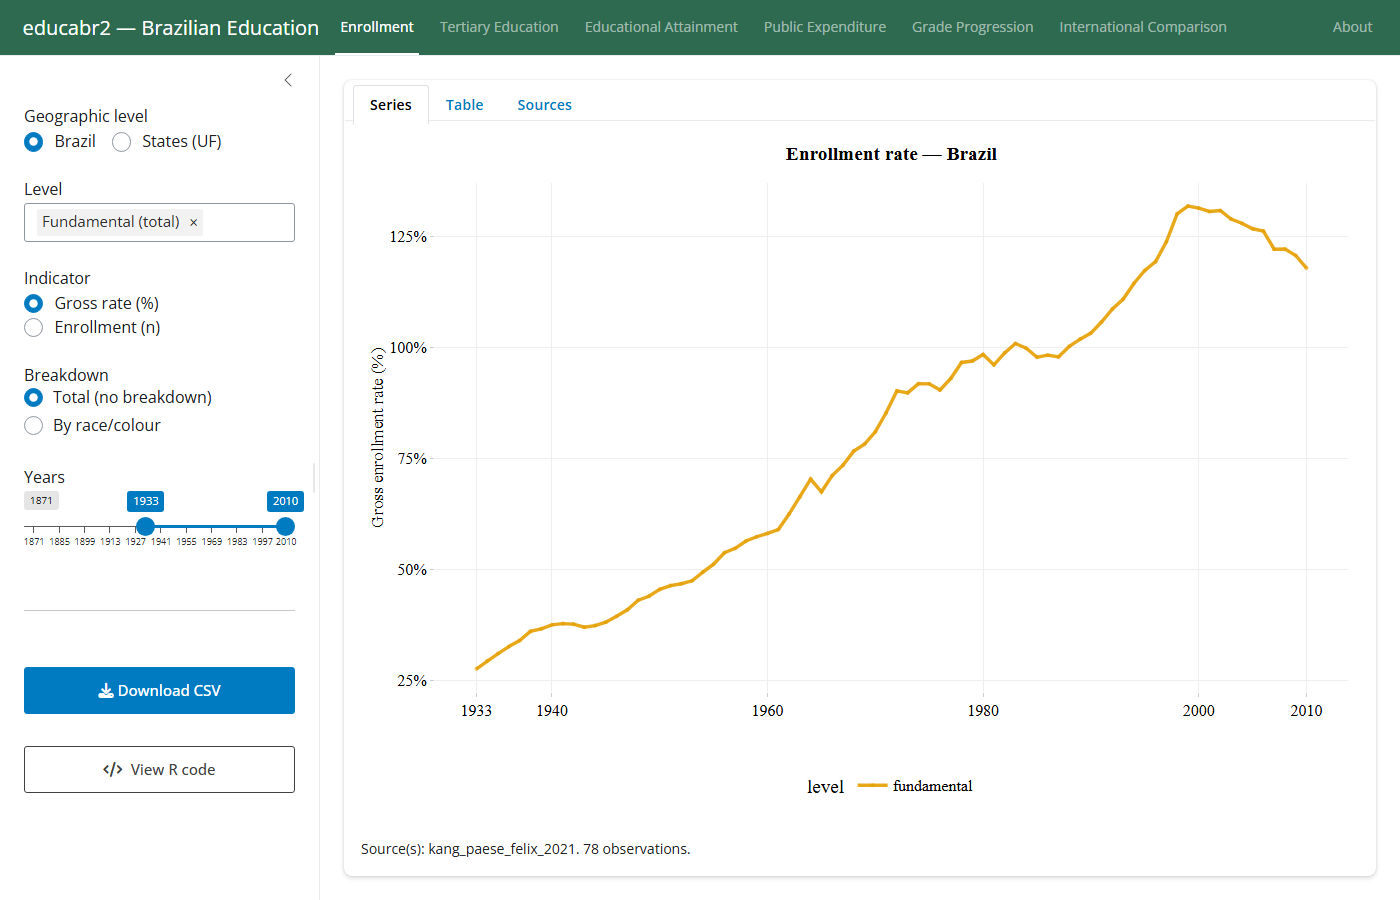
- Enrollment: Interactive exploration of basic education enrollments (EF1, EF2, EM) from 1933 to 2010, allowing users to filter by stage, state, and color/race (from 1960 onwards).
- Tertiary Education: Provides a multi-source comparative plot of higher education enrollments (1907–2024). Users can toggle individual series, view administrative divisions (public, private, for-profit vs. non-profit), and optionally plot the reconstructed EAD totals.
- Educational Attainment: Displays average years of schooling (1925–2015) by state and region, with filters for sex and color/race.
- Public Expenditure: Visualizes public spending on education as a share of GDP, per-student spending, and the fiscal regressivity double-ratios.
- Grade Progression: Explores the GDR6 flow ratio for the national level and 20 states, charting historical retention rates.
- International Comparison: Places the Brazilian trajectory in comparative perspective using the harmonized educational attainment shares of Lee & Lee (2016), exposed through the
get_attainment()API. Users select any combination of countries (Brazil plus a set of Latin American, European, and North American comparators is pre-loaded), an attainment level (completed primary, secondary, or tertiary), and an optional breakdown by sex, and the tab plots the share of the population aged 15–64 that completed each level from 1870 to 2010. This allows the magnitude and timing of Brazil’s educational expansion to be read directly against the international record within the same interactive interface.
D.9.1 The “View R Code” Feature
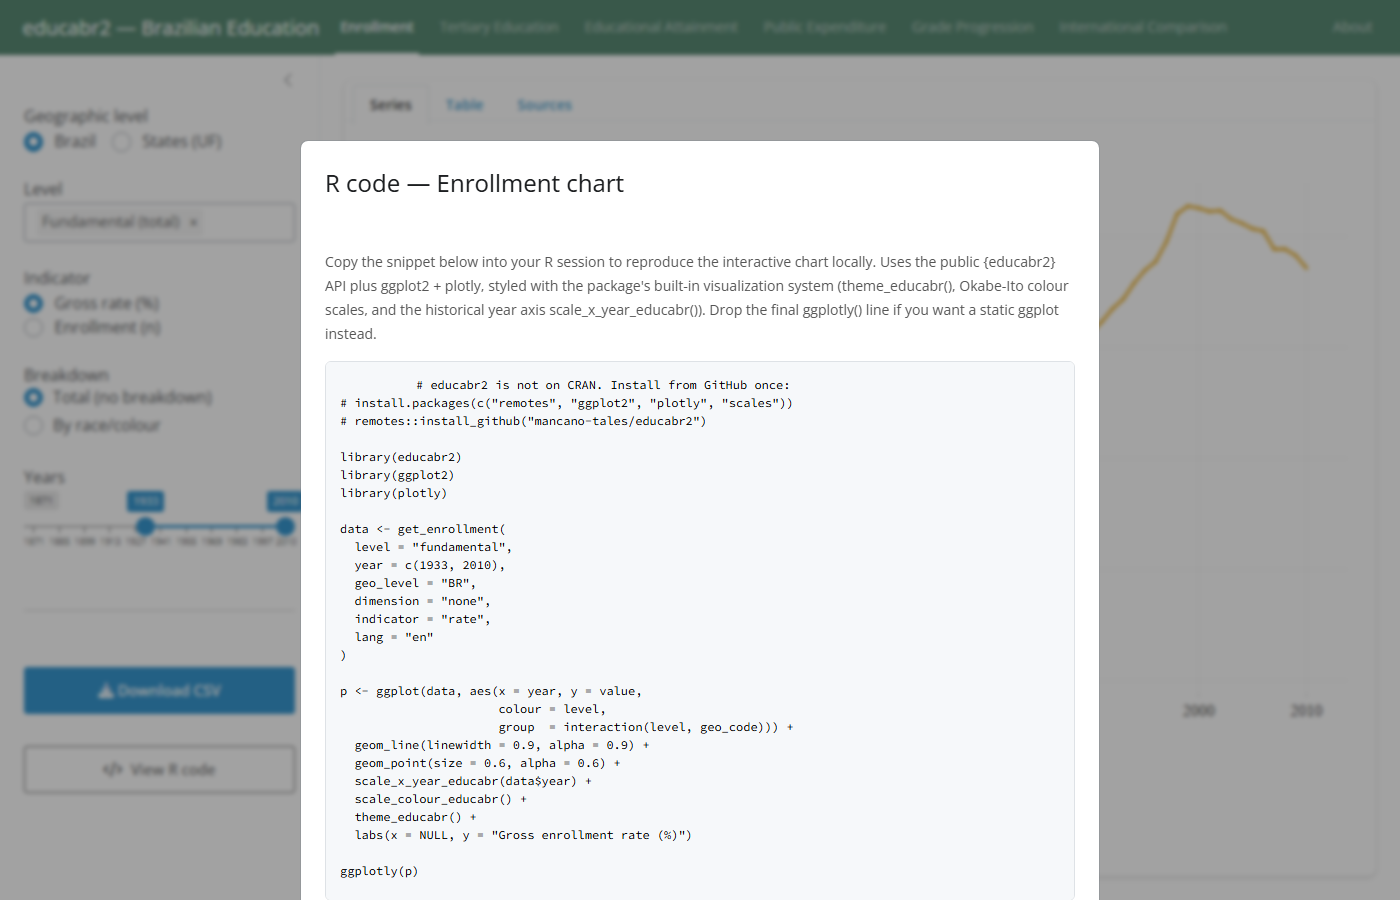
A key design feature of the dashboard is the “View R code” button, present on every visualization tab. Clicking this button opens a modal window containing a self-contained R script. This script loads educabr2 and ggplot2, calls the exact API query with the filters selected on the dashboard UI, and plots the resulting data using the package’s own visualization system (theme_educabr(), the Okabe-Ito color scales, and the historical year axis scale_x_year_educabr(), described in the next section), so that the reproduced chart carries the same visual standards as the dashboard itself.
This feature acts as an educational bridge, allowing users to transition from graphical data exploration to reproducible, scripted data analysis.
Figure D.8 shows the dashboard’s Enrollment tab as rendered locally, with the sidebar filters on the left and the interactive chart, data table, and source cards organized as sub-tabs on the right. Figure D.9 shows the modal window opened by the “View R code” button, containing the self-contained reproduction script for the chart on screen.
D.10 Data Visualization and Styling
To facilitate the reproduction of high-quality, publication-ready graphics, educabr2 includes a built-in visualization system. This system is designed around the visual standards of the Data Visualization framework by Healy (2019/2026) and conforms to the aesthetic style of this dissertation.
The styling is applied through three main exported components:
theme_educabr(): A customized theme based onggplot2::theme_minimal()that optimizes plot proportions, margins, and grids.scale_fill_educabr()andscale_colour_educabr(): Discrete color scales mapping to the colorblind-safe Okabe-Ito qualitative palette.scale_x_year_educabr(): A year-axis scale designed for the long historical series that are the norm in the package. Standardggplot2breaks assume spans of a few years or decades and become unreadable on century-long series; this scale picks the break spacing from the span of the data actually plotted (every 20 years beyond six decades, every 10 years for intermediate spans,pretty()breaks below that), always labels the first and last year present in the series, and drops any grid break that would collide with those extremes.
D.10.1 Typography and TinyTeX Integration
The theme_educabr() function automatically searches the system’s local paths for TinyTeX (which contains the opentype version of the standard LaTeX font, Latin Modern Roman). If found, the theme registers the font dynamically using the showtext and sysfonts packages, allowing users to render plots with the exact LaTeX typography used in this book. If the font files are not found on the local system or the packages are missing, the theme falls back gracefully and silently to the system’s default serif font.
D.10.2 Visual Mode Toggle (plot_titles)
To allow flexibility between standard graphics (e.g., for presentations or blog posts) and formal academic writing (e.g., for journals or LaTeX documents), the theme_educabr() function exposes a plot_titles logical argument:
plot_titles = TRUE(Default): Standard titles, subtitles, and captions are styled and rendered inside the plot canvas itself.plot_titles = FALSE: Completely strips the titles, subtitles, and captions from the ggplot canvas. This is useful for LaTeX/Quarto integration where captions and notes are written directly in the document code (e.g., usingfig-caporfignoteenvironments) rather than embedded inside the graphic files.
library(ggplot2)
library(educabr2)

# Query schooling years by sex
df <- get_schooling(geo_level = "BR", dimension = "sex")

# Plot using the custom theme with titles omitted for academic manuscripts
ggplot(df, aes(x = year, y = value, colour = dim_sex)) +
  geom_line(linewidth = 1) +
  theme_educabr(plot_titles = FALSE) +
  scale_colour_educabr() +
  scale_x_year_educabr(df$year)
D.11 Data Validation
The structural design of educabr2 allows for built-in empirical validation by systematically preserving periods where independent data collection efforts overlap. The most rigorous cross-checks occur within the tertiary enrollment panel (enrollment_tertiary), particularly during the transition from academic reconstructions to modern official microdata.
First, the package validates cross-dataset consistency to prevent internal drift. The long-run tertiary enrollment series compiled by Kang et al. (2021) (1933–2010) is shipped both as a standalone thematic dataset (enrollment_kang_fgv) and as a constituent source within the multi-source panel. A programmatic check confirms that across all 69 overlapping years, the counts are byte-identical between the independent internal structures.
Second, the multi-source panel allows for direct triangulation of historical estimates against official synopses before the latter were interrupted. In the 1995–2003 window, multiple independent efforts estimate total systemic enrollment. For example, in 1995, the official INEP Sinopse Estatística reports a total of 1,759,703 enrolled students. The academic reconstruction by Durham (2005) reports exactly 1,759,703. The harmonized series by Kang et al. (2021) also reports exactly 1,759,703. This perfect convergence provides strong empirical validation for the academic estimates used to bridge the earlier developmentalist decades where official data is sparse.
Finally, for the contemporary era (2010–2024), the package exposes both INEP’s official Power BI dashboard estimates and a raw, independent aggregation of INEP’s microdata. While the package’s sources.yaml dictionary documents a known divergence in detailed administrative network subsets (e.g., municipal vs. state public) from 2012 onward due to changing official reporting criteria, a formal comparison confirms that the macro-level totals for the system as a whole remain perfectly aligned (zero divergence) across all fifteen years. By preserving these competing official vectors rather than masking them, educabr2 allows researchers to test the robustness of their own models against institutional reporting artifacts.
D.12 Data Availability and Reproducibility
The educabr2 package is open-source and hosted on GitHub at https://github.com/mancano-tales/educabr2. The package includes a pkgdown reference website hosted at https://mancano-tales.github.io/educabr2/, which contains a function reference, changelogs, and vignettes in English and Portuguese (Figure D.10).
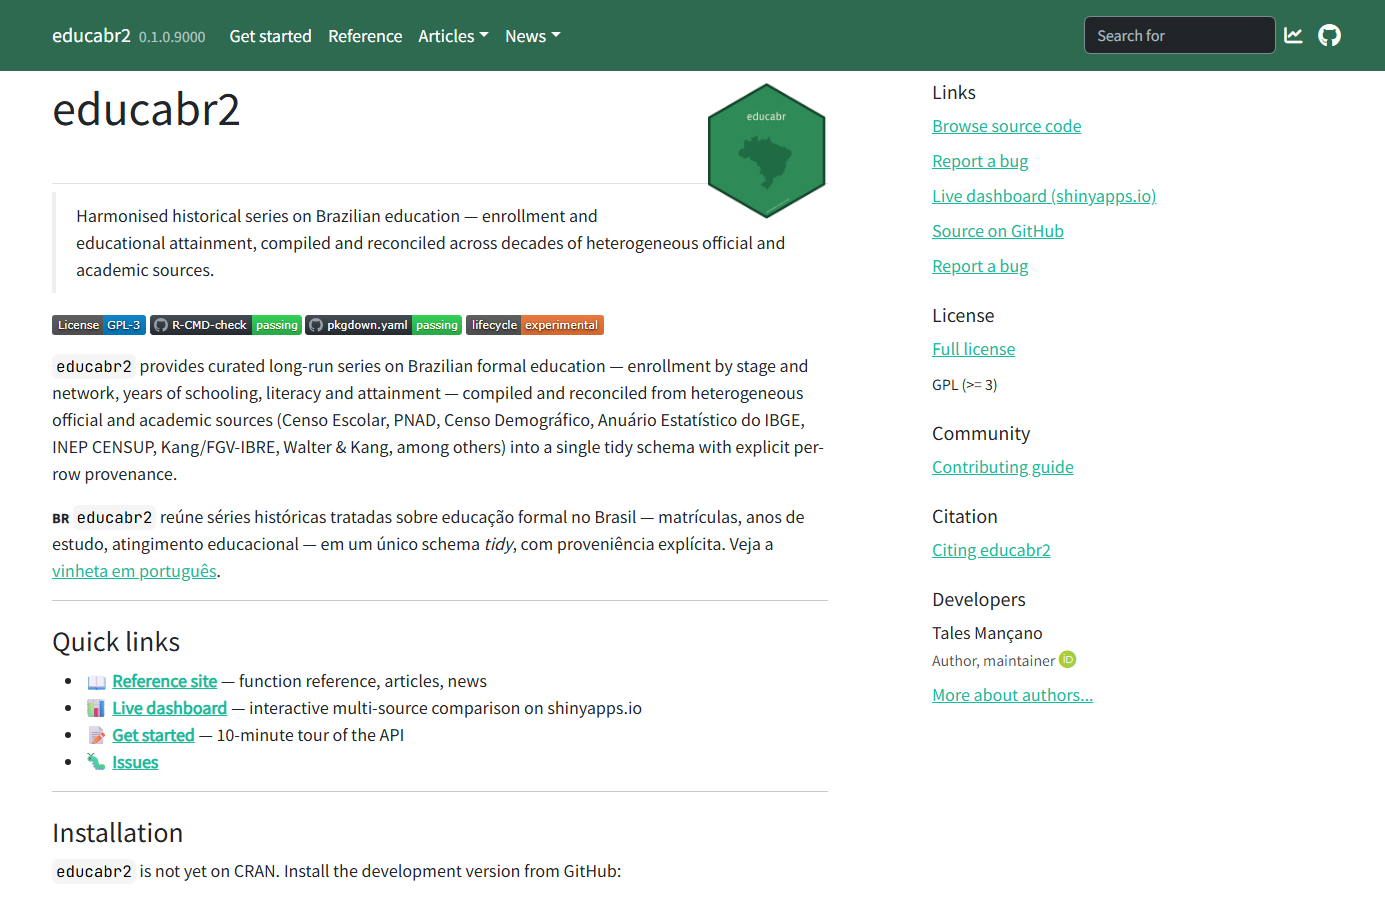
pkgdown documentation website, with installation instructions, bilingual vignettes, and links to the live dashboard.
Every dataset loaded by the package functions is embedded as an internal package dataset (lazy-loaded). The source code and raw data-cleaning pipelines are located in the data-raw/ folder of the package repository, ensuring that every harmonization decision and deduplication choice is fully auditable and reproducible.
To assist with academic citation, the package includes the educabr_cite() utility. Running this function on any source key (or on the source column of a query result) returns the full reference of the original compilation, ready to paste into a manuscript:
# Cite a specific source used in the analysis
educabr_cite("kang_paese_felix_2021", style = "text")
#> Kang, T. H., Paese, L. H. Z., & Felix, N. F. A. (2021). Late
#> and unequal: Enrolments and retention in Brazilian education,
#> 1933-2010. Revista de Historia Economica / Journal of Iberian
#> and Latin American Economic History, 39(2), 191-218.
#> doi:10.1017/S0212610921000112
The same call with style = "bibtex" returns a BibTeX entry ready for a .bib file, and calling educabr_cite() with no arguments lists the references for every bundled source. This design follows the citation ethics that the censobr paper makes explicit (Pereira & Barbosa, 2026a): researchers should cite both the package, for the harmonization work, and the original academic or official compilations whose painstaking archival effort produced the raw numbers — a non-trivial concern when, as here, the sources are individual scholars rather than statistical agencies.
This appendix is written in the format of the dataset papers discussed in the introduction, and deliberately so: beyond documenting the dissertation’s data infrastructure, it is designed to become, with adjustments of framing and length, a standalone software-and-data article in the mold of the censobr publication in Dados (Pereira & Barbosa, 2026a). The claim such a paper would make is the one this appendix has substantiated: that the fragmented century of Brazilian education statistics — dispersed across yearbooks, ministry reports, academic reconstructions, and modern registers — now exists as a single, documented, citable, and freely installable research object, and that the transparency practices developed by the international dataset-construction literature (Del Río et al., 2025a) can be applied at national scale by a single researcher with open tools.