
A continuous x-axis scale for integer-year time series that picks break
spacing according to the span of the data, so that century-long historical
series (the norm in educabr2) get readable, evenly spaced year labels.
The first and last years actually present in the series are always
labelled, and any grid break that would collide with those extremes is
dropped in their favour.
Arguments
- years
Numeric vector with the years actually plotted (typically
data$year). Used to compute the span and anchor the first/last labels.- ...
Additional arguments passed on to
ggplot2::scale_x_continuous().
Details
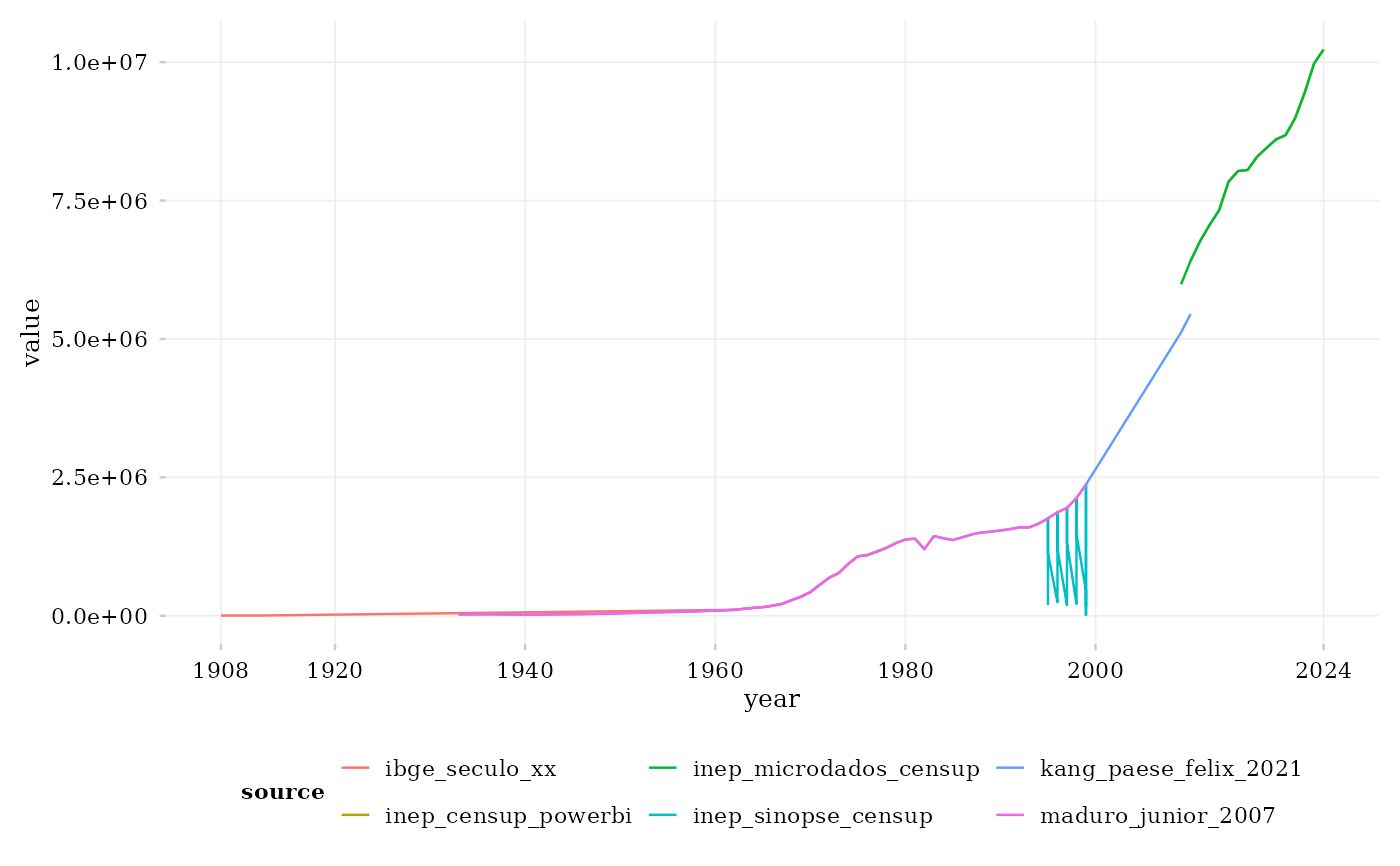
Break spacing by span of the series: more than 60 years, every 20 years;
25 to 60 years, every 10 years; under 25 years, pretty() breaks. Labels
are always four-digit years.
Examples
# \donttest{
library(ggplot2)
library(educabr2)
df <- get_enrollment(level = "superior", network = "total",
modality = "total", indicator = "count")
ggplot(df, aes(x = year, y = value, colour = source)) +
geom_line() +
scale_x_year_educabr(df$year) +
theme_educabr()
 # }
# }