Upper Secondary Funnel vs. Tertiary Transition, Wagstaff Index
Overview
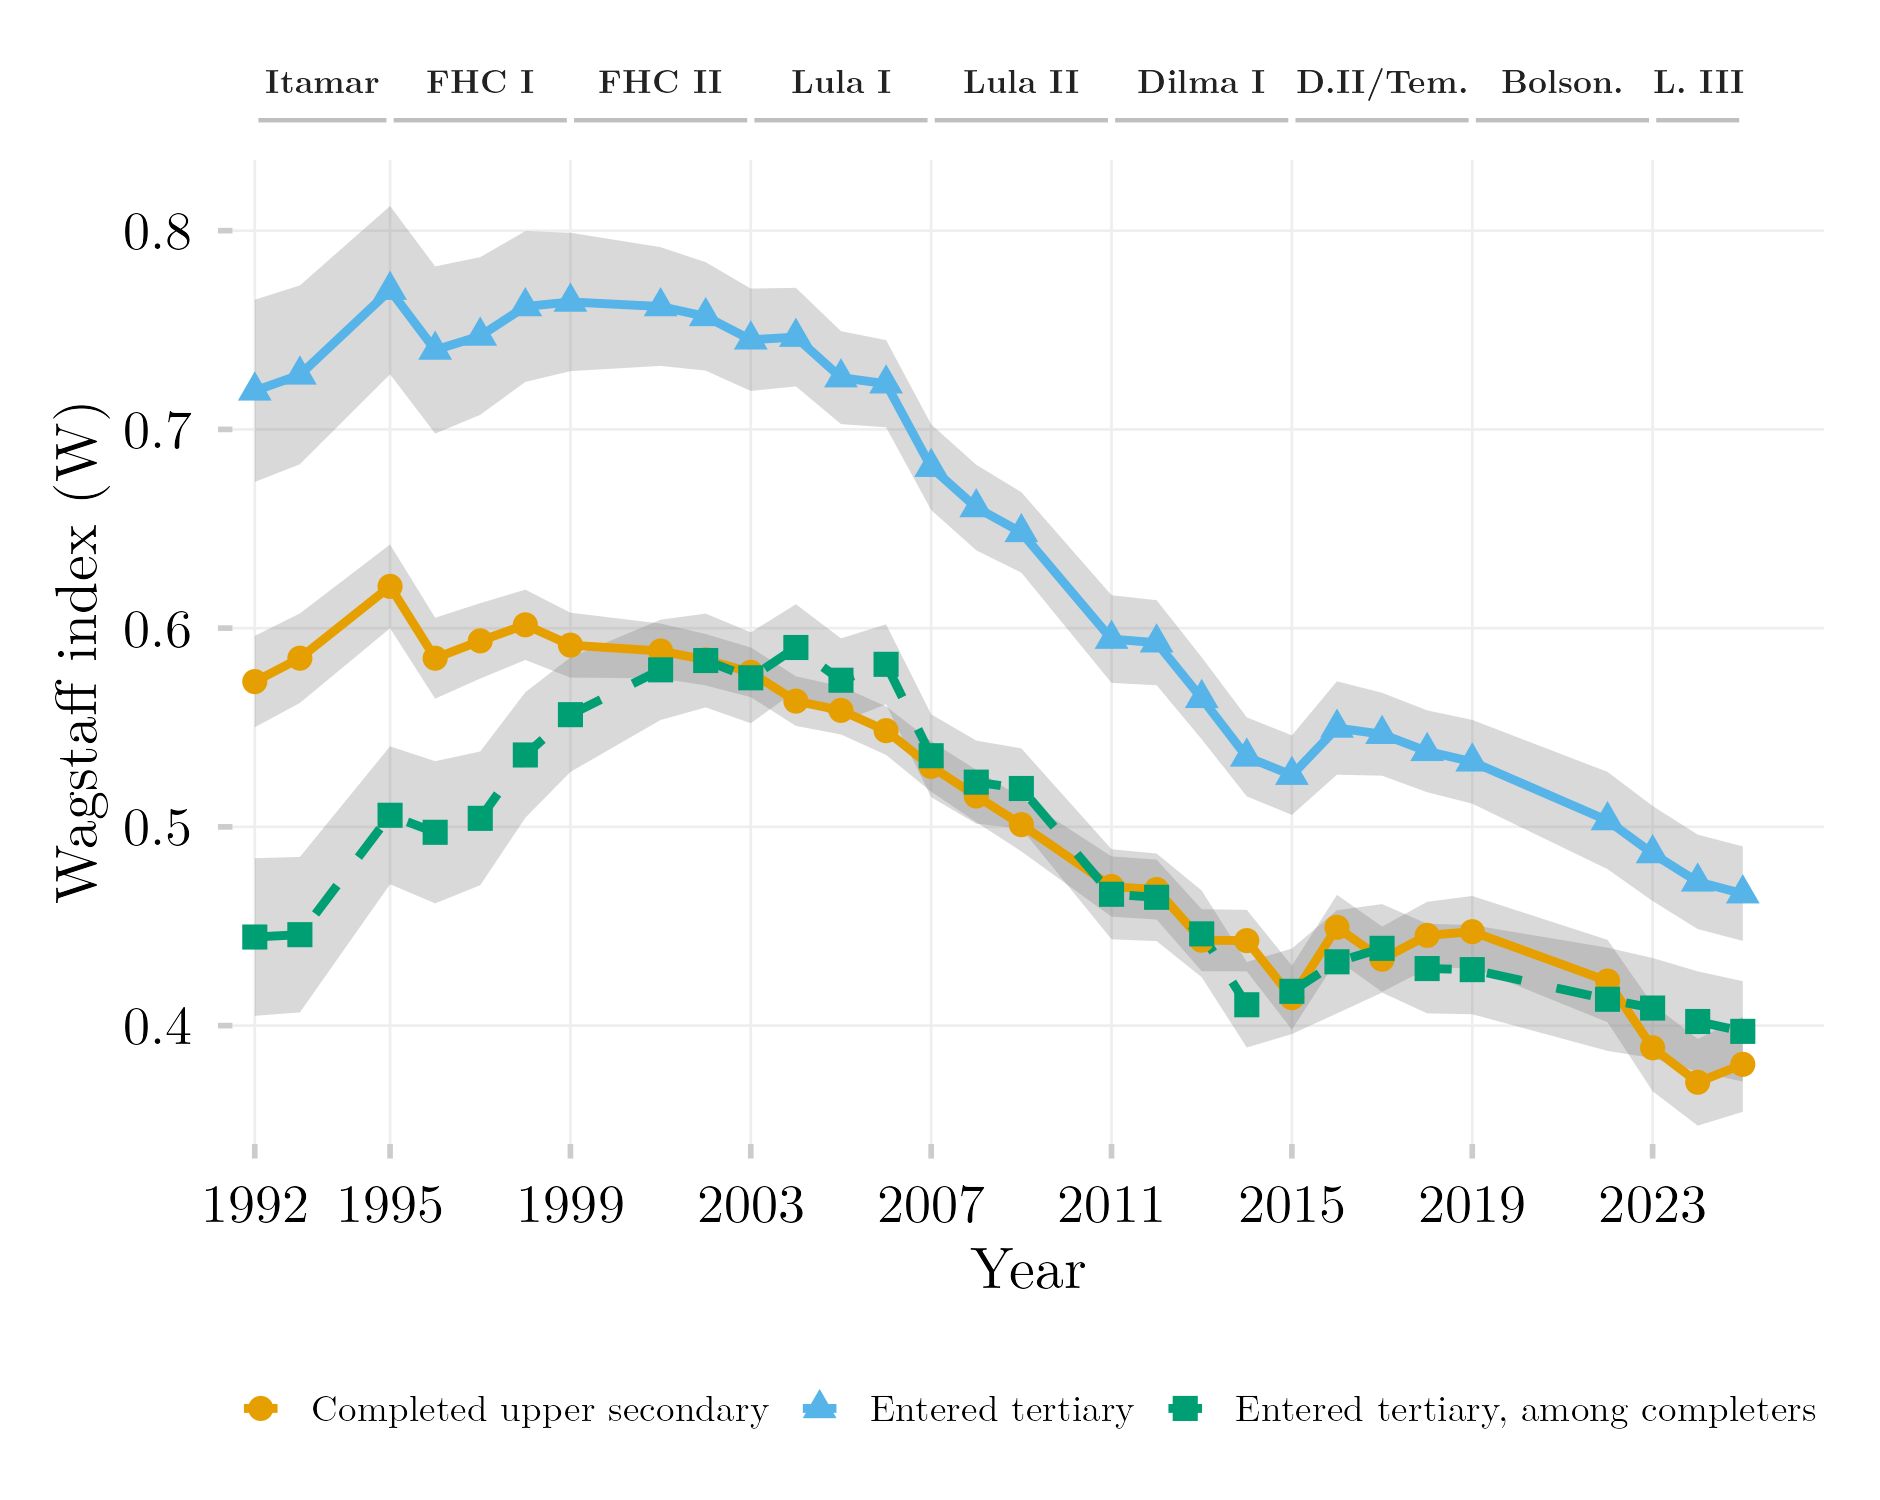
This figure separates two sources of income inequality in access to higher education among Brazilians aged 18–24: inequality in who finishes upper secondary school and inequality in who goes on to higher education among those who finished. Three series of the Wagstaff concentration index run from 1992 to 2025 — completion of upper secondary, entry into tertiary education, and entry into tertiary education conditional on completion, with income ranks recomputed within the completers. The distance between the second and third series is the contribution of the secondary-school funnel to tertiary inequality; the third series alone is what remains of income selectivity at the tertiary step itself. Data come from PNAD and PNAD Contínua (IBGE).
Methodology
All three series use the same estimator: the Wagstaff index (\(W = C / (1 - \mu)\)), computed by weighted survey GLM regression on fractional income ranks, under a uniform Kish design-effect approximation (\(\text{DEFF} = 2.0\)) across PNAD Anual and PNAD Contínua, with each year drawn from a single source (PNAD Anual through 2015, PNAD Contínua from 2016). The population is 18–24-year-olds in households with strictly positive per-capita income; the rural North is absent from PNAD Anual 2004–2015, and 2020–2021 are excluded. The two solid series are ordinary indices over the full cohort: completed upper secondary (medio_completo: eleven or more years of schooling or any tertiary enrollment in PNAD Anual, VD3004 \(\geq\) 5 in PNAD Contínua) and ever entered tertiary (ens_sup). The dashed series restricts the sample to those who completed upper secondary, recomputes the fractional income ranks within that subpopulation, and estimates \(W\) for ever entering tertiary on that basis — the standard conditional concentration index. Conditioning on completion is conditioning on an outcome that itself depends on income, and the pool of completers grows from 17.6% of the cohort in 1992 to 73.6% in 2025, so the conditional series mixes changes in the transition with changes in who is eligible: it is descriptive and identifies no policy effect. In 1992–1995 the years-of-schooling variable in PNAD Anual is missing for roughly 21–22% of respondents and is coded as not completed unless ens_sup is one, which biases the pool of completers in those years; the first four years should not be read substantively. The 2015/2016 instrument splice is visible as a step. Grey bands are 95% confidence intervals. Government labels indicate the president in office.
How to Cite
If you use this figure or the pipeline behind it, please cite both the dissertation and this specific analysis. References follow APA 7th edition.
Dissertation (in preparation; the entry will be updated after the defense):
Mançano, T. (2026). Inequality in access to tertiary education in Brazil: Household incomes, reforming policies, and the politics of who gets in (1990s–2020s) [Unpublished master’s thesis]. University of São Paulo.
This figure and pipeline:
Mançano, T. (2026, September 16). Upper secondary funnel vs. tertiary transition, Wagstaff index [Figure and reproducible pipeline]. Open Data Analysis. https://mancano-tales.github.io/open-data-analysis/posts/wagstaff-transicao-condicional/
In text: (Mançano, 2026) — when citing several analyses from this catalog in the same work, APA distinguishes them as 2026a, 2026b, … in the order they appear in the reference list.
BibTeX:
@mastersthesis{Mancano2026Thesis,
  author = {Man\c{c}ano, Tales},
  title  = {Inequality in Access to Tertiary Education in Brazil: Household
            Incomes, Reforming Policies, and the Politics of Who Gets In
            (1990s--2020s)},
  school = {University of S\~{a}o Paulo},
  year   = {2026},
  type   = {Master's thesis},
  note   = {Unpublished; Graduate Program in Political Science}
}

@misc{Mancano2026_wagstaff_transicao_condicional,
  author       = {Man\c{c}ano, Tales},
  title        = {Upper secondary funnel vs. tertiary transition, Wagstaff index},
  year         = {2026},
  month        = sep,
  howpublished = {Open Data Analysis, \url{https://mancano-tales.github.io/open-data-analysis/posts/wagstaff-transicao-condicional/}},
  note         = {Figure and reproducible pipeline. Source code: \url{https://github.com/mancano-tales/open-data-analysis}, folder posts/wagstaff-transicao-condicional/. Accessed YYYY-MM-DD}
}
A permanent version (Git tag + Zenodo DOI) will be linked here once the dissertation is defended; until then, cite the page URL above and add the date you accessed it (source code: https://github.com/mancano-tales/open-data-analysis, folder posts/wagstaff-transicao-condicional/).
Pipeline
This figure draws on the PNAD / PNAD Contínua Harmonization, 1992–2025 panel.
Run these scripts in this order, from the project root (each one writes to data-raw/, which the next one reads):
shared-pipeline/pnadc/000_PNADC_Download_Consolidate.R— downloads PNAD Contínua 2012–2025 (1st interview) withPNADcIBGE::get_pnadc()intodata-raw/pnadc_raw/and consolidates it intodata-raw/pnadc_consolidado_2012_2025_interview1.rdsshared-pipeline/pnadc/020_PNAD_Anual_Manual_Import_2001_2015.R— downloads the PNAD Anual 2001–2015 microdata from the IBGE FTP intodata-raw/pnad_anual_raw/and imports them intodata-raw/harmonizing-br-data/output/PNAD_Anual_2001_2015.parquetshared-pipeline/pnadc/050_PNAD_Historica_Manual_Import_1992_1999.R— same for PNAD Anual 1992–1999 (PNAD_Anual_1992_1999.parquet)shared-pipeline/pnadc/035_Splice_Microdados.R— splices PNAD Anual and PNAD Contínua into the harmonized panel —Microdados_Todas_Idades_1992_2025.parquetindata-raw/harmonizing-br-data/output/(sourcesshared-pipeline/utils/codigos_curso_pnad.R)shared-pipeline/pnadc/097F_Diag_Wagstaff_Transicao_Decomposicao.R— estimates the three Wagstaff series (and their decomposition) for ages 18–24 and 25–64 fromMicrodados_Todas_Idades_1992_2025.parquetand caches them indata-raw/harmonizing-br-data/output/097F_diag_wagstaff_transicao_decomposicao.rdsplot.R— reads the 097F cache; writes the figure tooutput/figures/wagstaff-transicao-condicional/— compare it with this post’sthumbnail.png
All of the upstream steps above are Tier A and are also run, in this same order, by shared-pipeline/build_public_data.R.
Reproducibility
Tier: A
This figure uses only public data, accessible via package/API without any credential (PNADcIBGE, and the IBGE FTP for PNAD Anual). Run the scripts in shared-pipeline/ in the order above to reconstruct the intermediate data; the PNAD/PNADC chain downloads several GB of microdata and takes hours on first run, and the caches in data-raw/ avoid repeating downloads.