Adjusted Relative Risk of Tertiary Education Access by Income (Decile and Quintile)
Overview
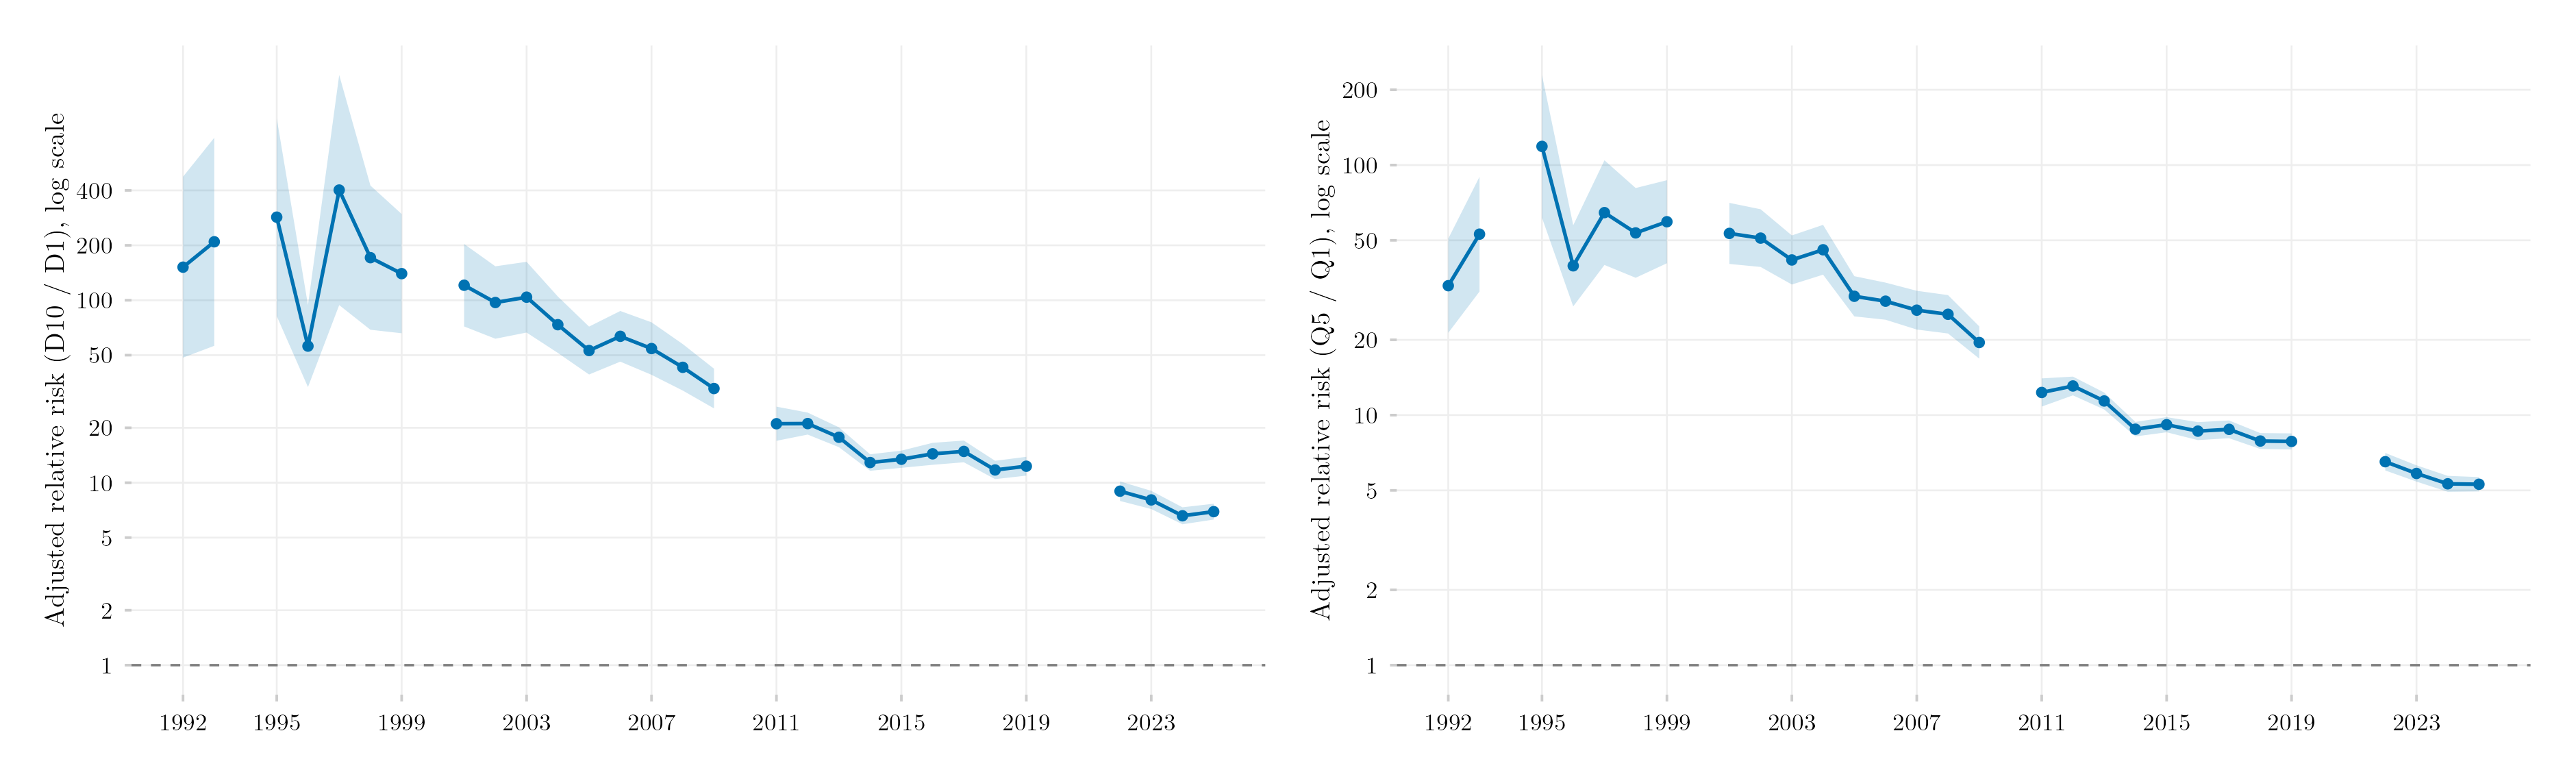
This figure tracks the adjusted relative risk (RRA) of ever enrolling in tertiary education, for Brazilians aged 18-24, comparing the richest and poorest strata of the household per-capita income distribution — decile 10 versus decile 1 on the left, quintile 5 versus quintile 1 on the right — from 1992 to 2025. The RRA is the ratio between the model-adjusted probability of access for the top stratum and the bottom stratum, holding age, sex, race, region, and urban/rural location fixed across strata. It is an adapted replication of the REN (income) panel of Figure 3 in Salata, Bringhenti & Miranda (2025), Dados, which uses the same logit + adjusted-predictions design but a narrower population (18-24-year-olds still living with their parents) and stops in 2022.
Methodology
For each year, a logit model of ens_sup (ever enrolled in tertiary education) is fit on income decile/quintile plus age, sex, race, region, and urban/rural status, with survey weights. The RRA is the ratio of the average adjusted predicted probability for the top stratum over the bottom stratum — computed with marginaleffects::avg_predictions() and hypotheses(), the R equivalent of the Stata margins/nlcom pair the original article uses. Confidence intervals are computed via the delta method on the log scale (log(top) - log(bottom), then exponentiated): applying the delta method directly on the ratio scale produces implausible intervals — including negative bounds, impossible for a probability ratio — whenever the poorest stratum’s estimated access is very close to zero, which is common in the 1990s (e.g. the poorest decile’s raw access rate was 0.1% in 1992). Years without a usable PNAD/PNADC estimate (1994, 2000, 2010 — no survey; 2020-2021 — excluded for pandemic-era data-quality reasons) show as a break in the line, following the same convention as this repository’s Wagstaff index time series post; the underlying data file does carry a linearly interpolated value for those years (replicating footnote 21 of the original article), but it is not plotted.
Differences from Salata, Bringhenti & Miranda (2025). Two deliberate design choices make this an adapted replication rather than an exact one, and the RRA magnitude does not match the published Figure 3 point for point: (1) this figure uses the general population of 18-24-year-olds, not only those still living with their parents (the original article’s rec_mod restriction, needed there because the model also requires the household head’s own characteristics) — for consistency with every other figure in this repository’s PNAD/PNADC panel; (2) as a consequence, income decile/quintile cut points are computed over the general population rather than within that narrower subsample, which — especially in the 1990s, when the poorest stratum’s access was close to zero — can widen the gap further. Comparing against the article’s own reported values, the gap between this replication and the original is large in the noisy 1990s (roughly 3-7x), moderate around 2011 (roughly 2.5x, 12.3 here versus 5.0 in the article), and nearly closes by 2017-2022 (roughly 1.15-1.25x) — the ratio is not constant nor does it grow over time, it shrinks as both series approach the present.
How to Cite
If you use this figure or the pipeline behind it, please cite both the dissertation and this specific analysis. References follow APA 7th edition.
Dissertation (in preparation; the entry will be updated after the defense):
Mançano, T. (2026). Inequality in access to tertiary education in Brazil: Household incomes, reforming policies, and the politics of who gets in (1990s–2020s) [Unpublished master’s thesis]. University of São Paulo.
This figure and pipeline:
Mançano, T. (2026, September 10). Adjusted relative risk of tertiary education access by income (decile and quintile) [Figure and reproducible pipeline]. Open Data Analysis. https://mancano-tales.github.io/open-data-analysis/posts/rra-renda-decil-quintil/
In text: (Mançano, 2026) — when citing several analyses from this catalog in the same work, APA distinguishes them as 2026a, 2026b, … in the order they appear in the reference list.
BibTeX:
@mastersthesis{Mancano2026Thesis,
  author = {Man\c{c}ano, Tales},
  title  = {Inequality in Access to Tertiary Education in Brazil: Household
            Incomes, Reforming Policies, and the Politics of Who Gets In
            (1990s--2020s)},
  school = {University of S\~{a}o Paulo},
  year   = {2026},
  type   = {Master's thesis},
  note   = {Unpublished; Graduate Program in Political Science}
}

@misc{Mancano2026_rra_renda_decil_quintil,
  author       = {Man\c{c}ano, Tales},
  title        = {Adjusted relative risk of tertiary education access by income (decile and quintile)},
  year         = {2026},
  month        = sep,
  howpublished = {Open Data Analysis, \url{https://mancano-tales.github.io/open-data-analysis/posts/rra-renda-decil-quintil/}},
  note         = {Figure and reproducible pipeline. Source code: \url{https://github.com/mancano-tales/open-data-analysis}, folder posts/rra-renda-decil-quintil/. Accessed YYYY-MM-DD}
}
A permanent version (Git tag + Zenodo DOI) will be linked here once the dissertation is defended; until then, cite the page URL above and add the date you accessed it (source code: https://github.com/mancano-tales/open-data-analysis, folder posts/rra-renda-decil-quintil/).
Pipeline
This figure draws on the PNAD / PNAD Contínua Harmonization, 1992–2025 panel.
Run these scripts in this order, from the project root (each one writes to data-raw/, which the next one reads):
shared-pipeline/pnadc/000_PNADC_Download_Consolidate.R— downloads PNAD Contínua 2012–2025 (1st interview) withPNADcIBGE::get_pnadc()intodata-raw/pnadc_raw/and consolidates it intodata-raw/pnadc_consolidado_2012_2025_interview1.rdsshared-pipeline/pnadc/020_PNAD_Anual_Manual_Import_2001_2015.R— downloads the PNAD Anual 2001–2015 microdata from the IBGE FTP intodata-raw/pnad_anual_raw/and imports them intodata-raw/harmonizing-br-data/output/PNAD_Anual_2001_2015.parquetshared-pipeline/pnadc/050_PNAD_Historica_Manual_Import_1992_1999.R— same for PNAD Anual 1992–1999 (PNAD_Anual_1992_1999.parquet)shared-pipeline/pnadc/035_Splice_Microdados.R— splices PNAD Anual and PNAD Contínua into the harmonized panel —Microdados_Todas_Idades_1992_2025.parquetandMicrodados_Jovens_18_24_1992_2025.parquetindata-raw/harmonizing-br-data/output/(sourcesshared-pipeline/utils/codigos_curso_pnad.R)shared-pipeline/pnadc/037_Modelos_Logit_RRA_Renda.R— fits the yearly logit models (decile and quintile) and computes the RRA with confidence intervals (RRA_Renda_1992_2025.csv)plot.R— readsRRA_Renda_1992_2025.csv; writes the figure tooutput/figures/rra-renda-decil-quintil/— compare it with this post’sthumbnail.png
All of the upstream steps above are Tier A and are also run, in this same order, by shared-pipeline/build_public_data.R.
Reproducibility
Tier: A
This pipeline uses only public data, accessible via package/API without any credential (PNADcIBGE). Run the scripts in shared-pipeline/pnadc/ in numeric order to reconstruct the intermediate data, then plot.R.