Average Household Income by Income Percentile
Overview
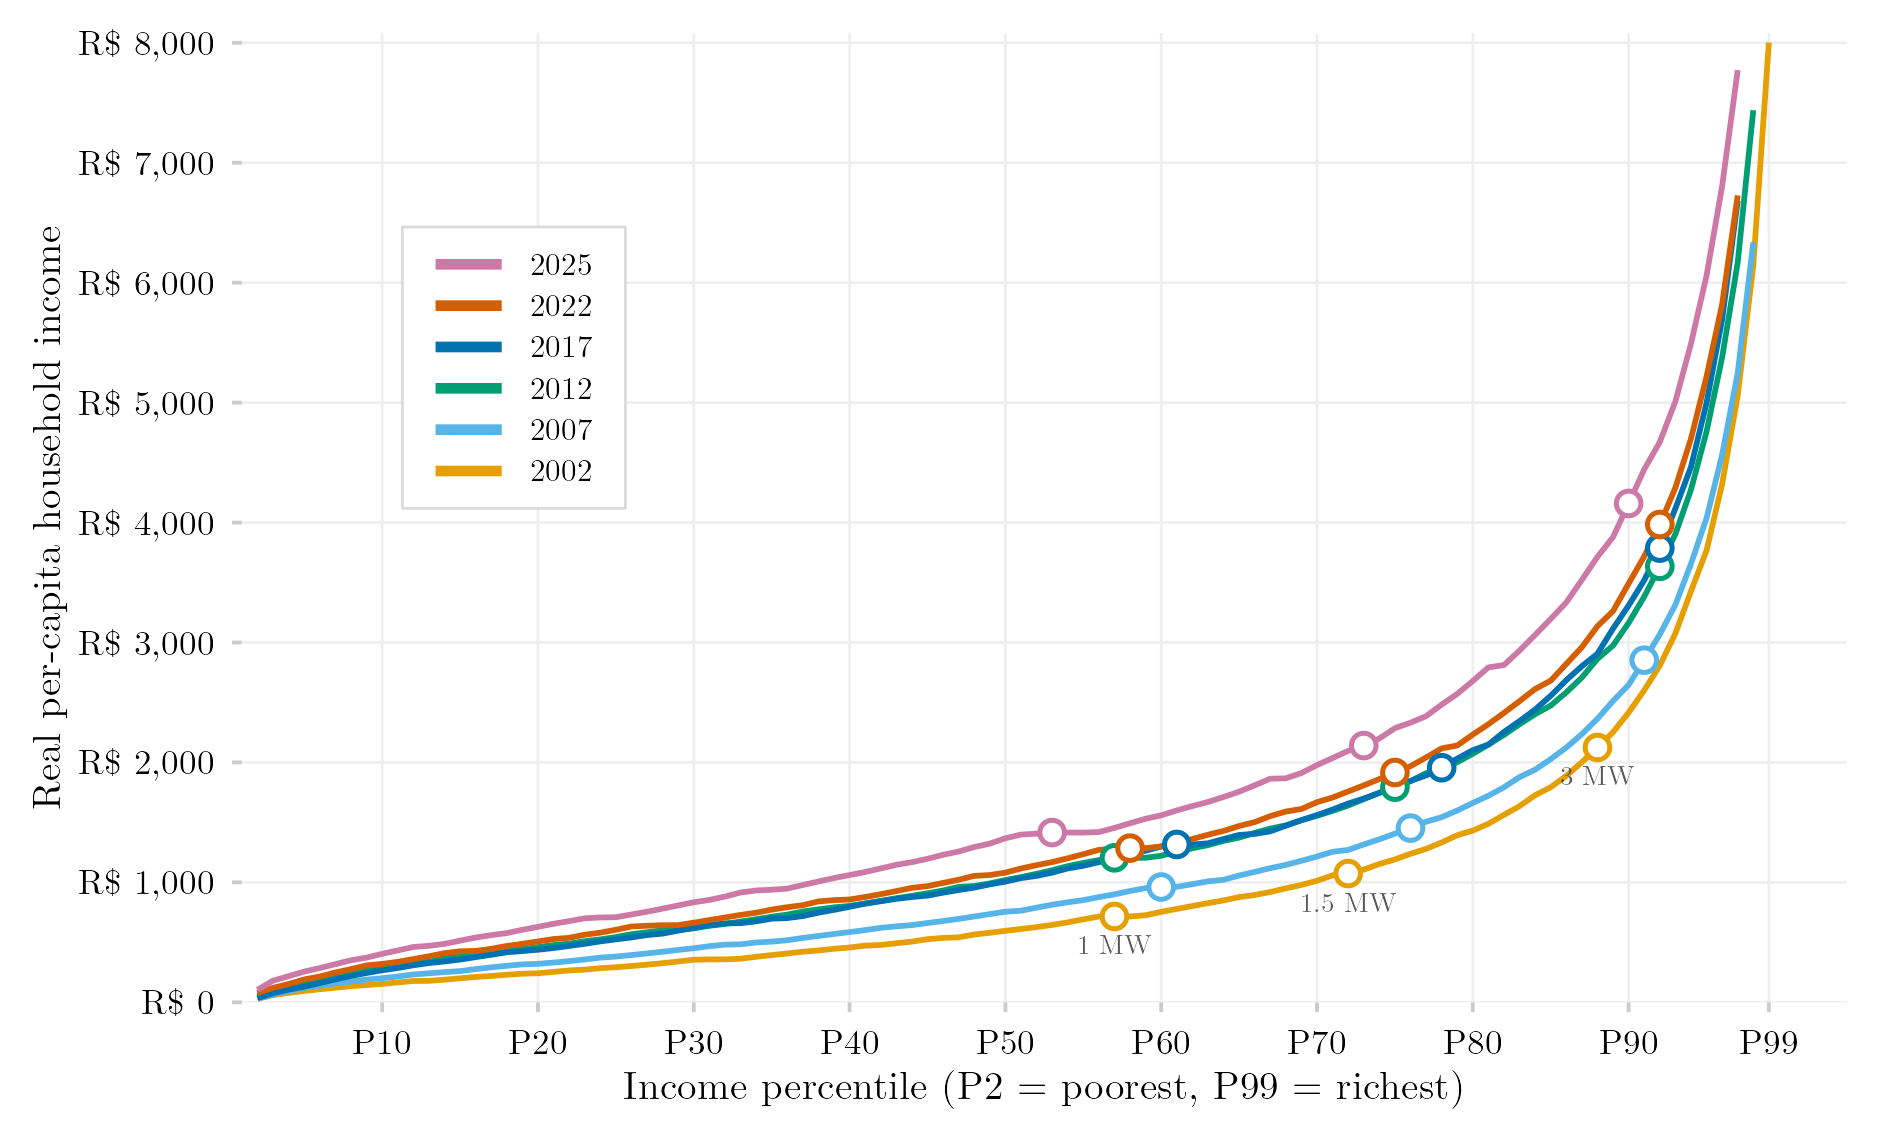
This figure plots average household income across the entire income distribution, from the poorest to the richest percentile, for a selection of years. It shows the shape of income inequality directly: a flatter line across most percentiles followed by a steep rise at the very top means income is concentrated among a small elite, while a more gradual, even slope indicates a more equal distribution. Reference markers show where income crosses one, one-and-a-half, and three times the minimum wage.
Methodology
Each line shows the weighted mean real per-capita household income within each income percentile group, for the selected years (2002, 2007, 2012, 2017, 2022, 2025 — five-year snapshots of a continuous annual series). Income is per-capita household income throughout — for PNAD Anual (up to 2015) it is rebuilt from the raw microdata as total household income (V4721) divided by the number of residents, excluding boarders, domestic workers and their relatives; for PNAD Contínua (2016 onwards) it is VD5008 — and households reporting no income are retained, so the series is on the same footing as the official statistics. Incomes are deflated to January 2024 prices via the IPCA from each survey’s reference month (September for PNAD Anual, mid-year for PNAD Contínua). Percentiles rank individuals using sampling weights; percentiles 1 and 100 are dropped for sampling instability, and the y-axis is truncated at R$8,000. Open circles mark the percentile at which mean per-capita household income equals one (1 MW), one-and-a-half (1.5 MW), and three (3 MW) times the national minimum wage in force in the survey’s reference month, deflated from that same date.
This version (2026-09-16) replaces the one published on 2026-08-09, which ranked only individuals with strictly positive income, used family rather than household income for the PNAD Anual years, and took the January minimum wage deflated from January — inconsistencies measured in the pipeline audit of 2026-09-16 (the 1 MW marker moved by up to 4 percentiles in some years).
How to Cite
If you use this figure or the pipeline behind it, please cite both the dissertation and this specific analysis. References follow APA 7th edition.
Dissertation (in preparation; the entry will be updated after the defense):
Mançano, T. (2026). Inequality in access to tertiary education in Brazil: Household incomes, reforming policies, and the politics of who gets in (1990s–2020s) [Unpublished master’s thesis]. University of São Paulo.
This figure and pipeline:
Mançano, T. (2026, September 16). Average household income by income percentile [Figure and reproducible pipeline]. Open Data Analysis. https://mancano-tales.github.io/open-data-analysis/posts/renda-media-centil/
In text: (Mançano, 2026) — when citing several analyses from this catalog in the same work, APA distinguishes them as 2026a, 2026b, … in the order they appear in the reference list.
BibTeX:
@mastersthesis{Mancano2026Thesis,
  author = {Man\c{c}ano, Tales},
  title  = {Inequality in Access to Tertiary Education in Brazil: Household
            Incomes, Reforming Policies, and the Politics of Who Gets In
            (1990s--2020s)},
  school = {University of S\~{a}o Paulo},
  year   = {2026},
  type   = {Master's thesis},
  note   = {Unpublished; Graduate Program in Political Science}
}

@misc{Mancano2026_renda_media_centil,
  author       = {Man\c{c}ano, Tales},
  title        = {Average household income by income percentile},
  year         = {2026},
  month        = sep,
  howpublished = {Open Data Analysis, \url{https://mancano-tales.github.io/open-data-analysis/posts/renda-media-centil/}},
  note         = {Figure and reproducible pipeline. Source code: \url{https://github.com/mancano-tales/open-data-analysis}, folder posts/renda-media-centil/. Accessed YYYY-MM-DD}
}
A permanent version (Git tag + Zenodo DOI) will be linked here once the dissertation is defended; until then, cite the page URL above and add the date you accessed it (source code: https://github.com/mancano-tales/open-data-analysis, folder posts/renda-media-centil/).
Pipeline
Run these scripts in this order, from the project root (each one writes to data-raw/, which the next one reads):
shared-pipeline/pnadc/020_PNAD_Anual_Manual_Import_2001_2015.R— downloads the raw PNAD Anual 2001–2015 microdata (fixed-width.txt+ SAS layouts) from the IBGE FTP intodata-raw/pnad_anual_raw/<year>/—plot.Rreads these raw files directlyshared-pipeline/pnadc/000_PNADC_Download_Consolidate.R— downloads PNAD Contínua 2012–2025 (1st interview) withPNADcIBGE::get_pnadc()intodata-raw/pnadc_raw/and consolidates it intodata-raw/pnadc_consolidado_2012_2025_interview1.rdsplot.R— rebuilds per-capita household income from the raw PNAD Anual files indata-raw/pnad_anual_raw/(viashared-pipeline/utils/renda_domiciliar_pnad.R) and reads the PNAD Contínua years fromdata-raw/pnadc_consolidado_2012_2025_interview1.rds; the minimum-wage series is fetched online from IPEADATA (ipeadatar) on first run; writes the figure tooutput/figures/renda-media-centil/— compare it with this post’sthumbnail.png
All of the upstream steps above are Tier A and are also run, in this same order, by shared-pipeline/build_public_data.R.
Reproducibility
Tier: A
This pipeline uses only public data, accessible via package/API without any credential (PNADcIBGE, censobr, sidrar, ipeadatar). Run the scripts in shared-pipeline/ in numeric order to reconstruct the intermediate data.