Routes into Tertiary Education by Per-Capita Income Decile: the 2013 and 2020 Secondary-School Cohorts
Overview
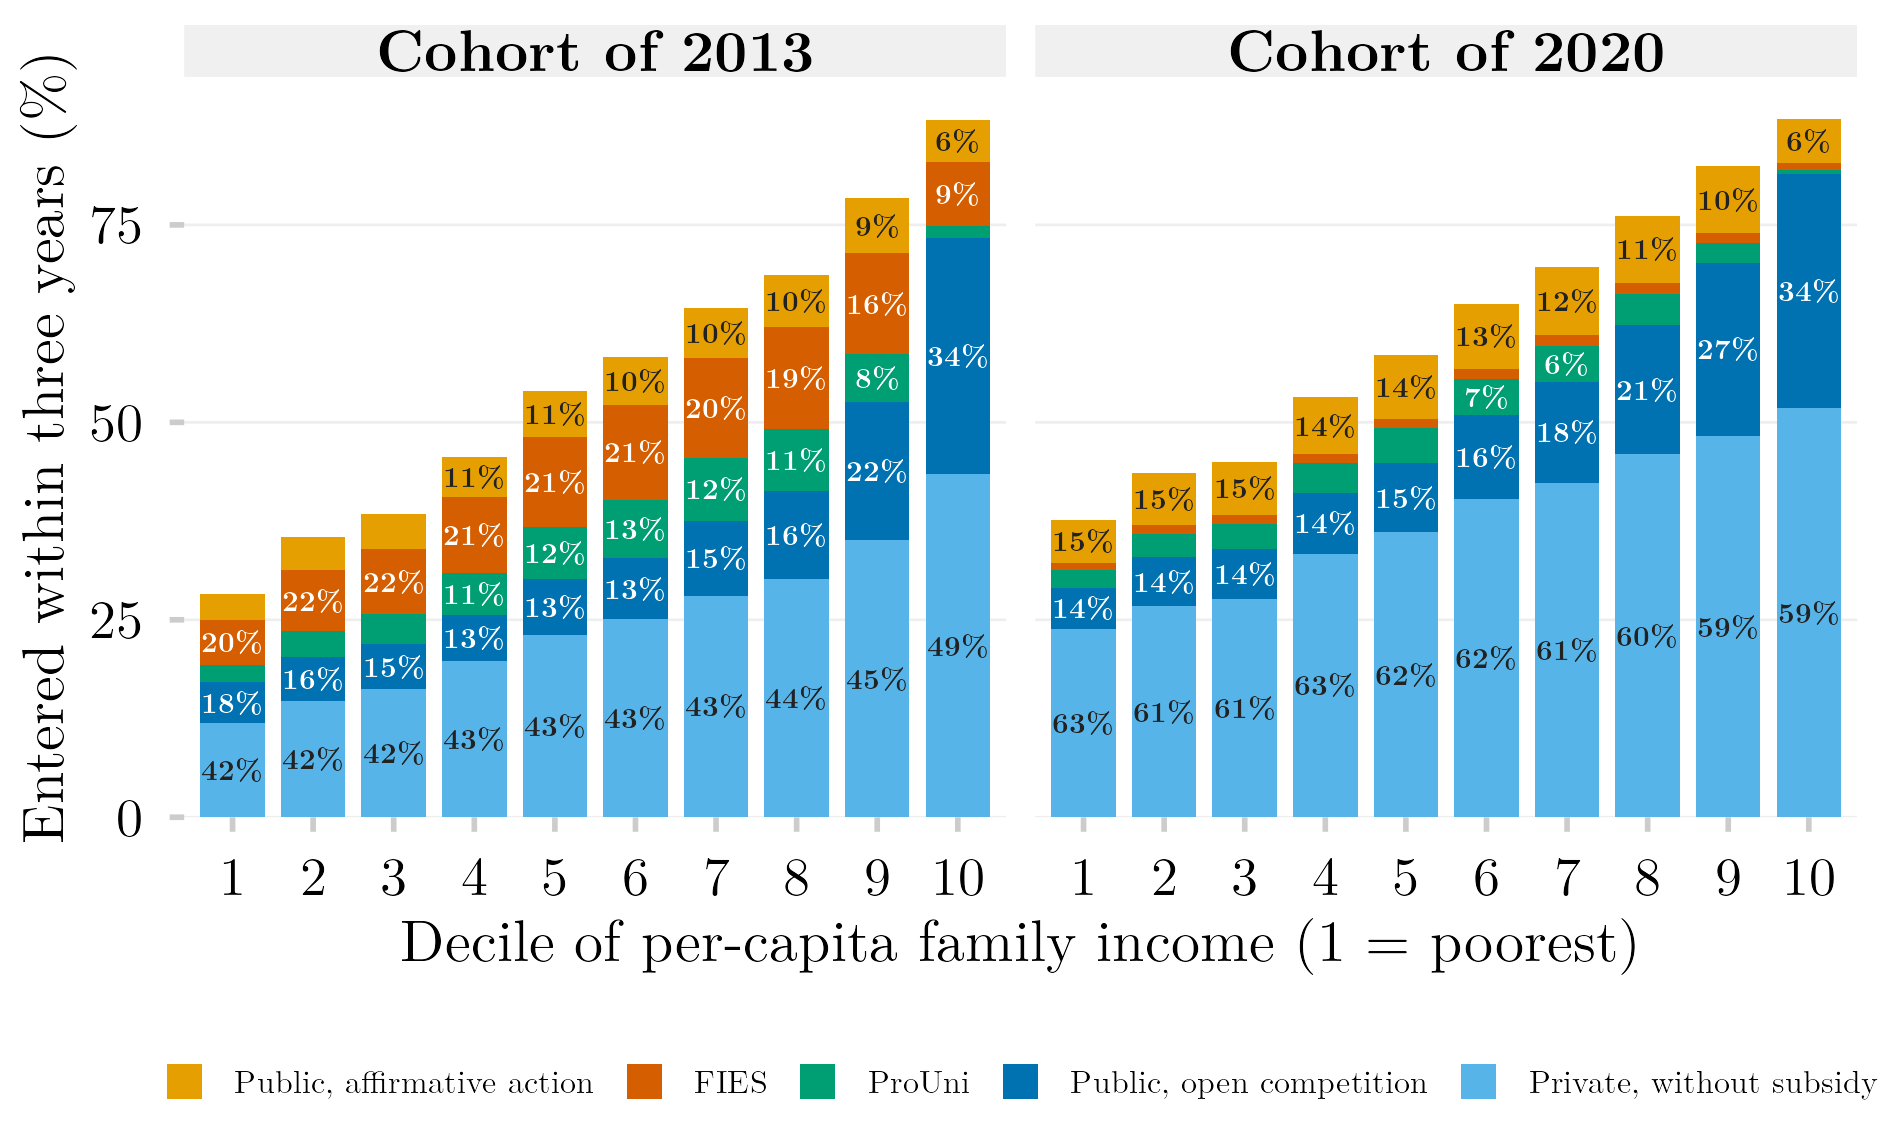
Each bar is the share of an income decile of a secondary-school cohort that entered tertiary education within three years of its final school year. The segments split that entry by route: a public institution through a reserved seat, a public institution through open competition, ProUni, FIES, or a private institution with no subsidy. Bar height is the decile’s total entry probability; the percentage printed in each segment is that route’s share of the decile’s entrants. Between the 2013 and 2020 cohorts, FIES almost disappears at every income level, the reserved-seat route grows, and unsubsidised private study becomes about 60% of entry in every decile, up from 42–49% in 2013.
The data are linked administrative records (Censo Escolar, ENEM, Censo da Educação Superior) queried through INEP’s SEDAP+ platform, which returns only aggregate tables. The aggregate tables that the figure reads, and the exact SQL of every query that produced them, are published with this post, so the figure reproduces without a credential.
Methodology
Cohort and linkage. The cohort is every student enrolled in the final year of secondary education in the Censo Escolar of 2013 or 2020 (TP_ETAPA_ENSINO in 27, 28, 29, 32, 33, 34, 37, 38), aged 16–22, who sat the ENEM of the same year. Students are linked across the three registers by masked CPF. The cohorts have 1,229,035 (2013) and 867,132 (2020) students.
Entry. A student counts as having entered if any enrolment record with a year of entry within the three following years (2014–2016 or 2021–2023) appears in the Censo da Educação Superior, whatever that record’s later status. Students who dropped out, suspended the course or transferred during their first year therefore count as entrants.
Route. Each entrant is assigned one route by a priority rule applied to all of that person’s records in the window: public with a reserved seat (IN_RESERVA_VAGAS), then public through open competition, then ProUni (full or partial), then FIES, then private with no subsidy. When the same person is flagged for ProUni and FIES, ProUni takes priority by convention; reversing it moves mass between the two subsidised segments without changing their combined height.
Income deciles. Income is the ENEM respondent’s declared family income bracket (seventeen brackets, midpoints in minimum wages of 0, 0.5, 1.25, 1.75, 2.25, 2.75, 3.5, 4.5, 5.5, 6.5, 7.5, 8.5, 9.5, 11, 13.5, 17.5 and 25), divided by the midpoint of the declared household-size group (1.8, 3.5, 5.4 and 7.8). The sixty-eight resulting cells are ordered by per-capita income and cut into deciles within each cohort; cells straddling a boundary are split proportionally.
Privacy layer. SEDAP+ returns counts under a differential-privacy budget (\(\varepsilon = 1\)) and suppresses small result cells: 0.49% of cells in 2013 and 2.24% in 2020, all ProUni or FIES cells at per-capita incomes of 0.83 minimum wages or more. The counts are otherwise exact at this level of aggregation, so no confidence bands are drawn.
Limits. Everything is conditional on having sat the ENEM in the year of completion, and ENEM participation is stratified by school network, so entry of the poorest students is understated. The financing indicators are missing for most enrolment records, and missingness is absorbed into the unsubsidised private category, so ProUni and FIES are floors. “Public” includes state and municipal institutions, which the federal quota law of 2012 does not bind.
An earlier definition of entry
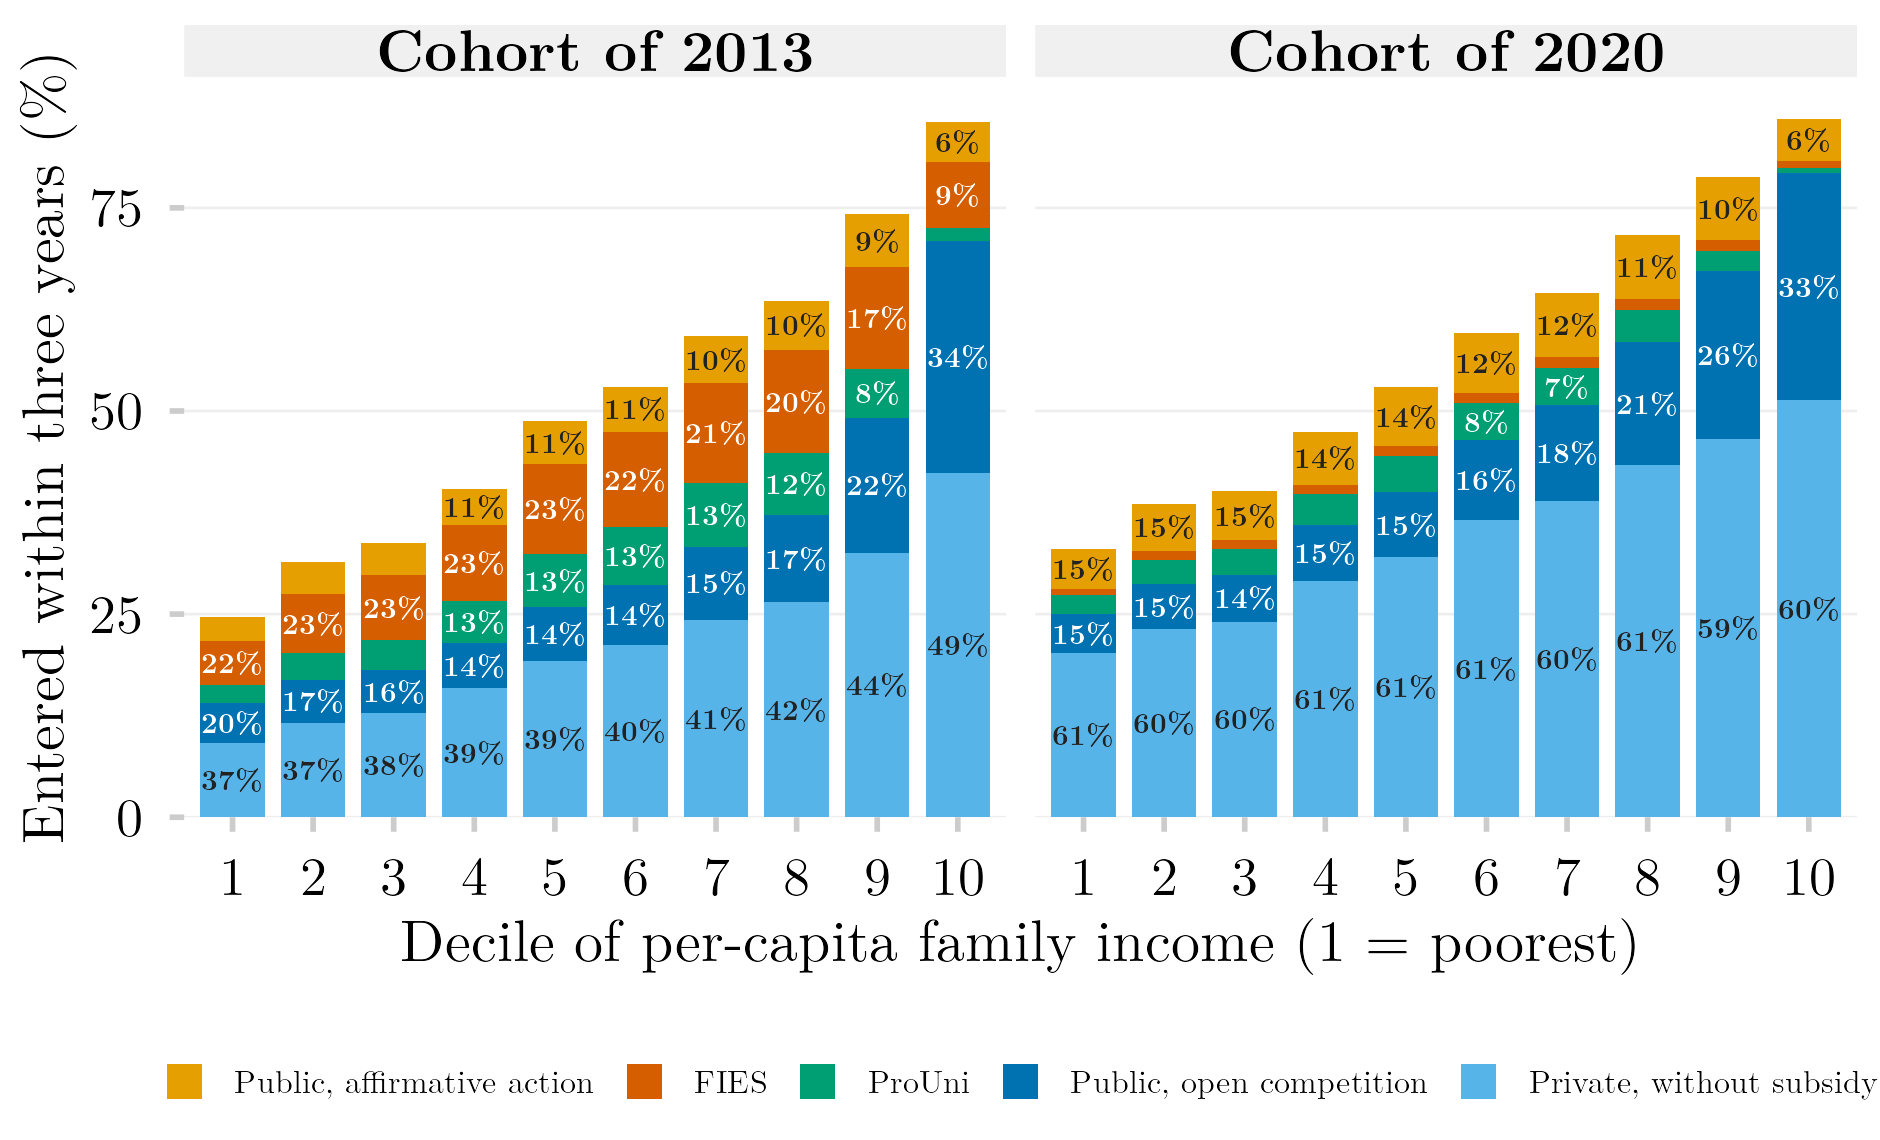
The first version of this figure counted only enrolment records flagged IN_MATRICULA = 1, which marks a record active or completed at the census date. Under that definition, a student who entered and left before the census of the entry year was counted as never having entered. Removing the flag adds about 55,000 entrants to the 2013 cohort (+8.7%) and 41,000 to the 2020 cohort (+8.2%). Almost all of them fall in the unsubsidised private route, which rises by 2.8 to 4.4 percentage points in the lower seven deciles; ProUni and FIES move by less than half a point. The figure below reproduces the earlier definition for comparison.
How to Cite
If you use this figure or the pipeline behind it, please cite both the dissertation and this specific analysis. References follow APA 7th edition.
Dissertation (in preparation; the entry will be updated after the defense):
Mançano, T. (2026). Inequality in access to tertiary education in Brazil: Household incomes, reforming policies, and the politics of who gets in (1990s–2020s) [Unpublished master’s thesis]. University of São Paulo.
This figure and pipeline:
Mançano, T. (2026, September 23). Routes into tertiary education by per-capita income decile: The 2013 and 2020 secondary-school cohorts [Figure and reproducible pipeline]. Open Data Analysis. https://mancano-tales.github.io/open-data-analysis/posts/portas-renda-coortes-empilhado/
In text: (Mançano, 2026) — when citing several analyses from this catalog in the same work, APA distinguishes them as 2026a, 2026b, … in the order they appear in the reference list.
BibTeX:
@mastersthesis{Mancano2026Thesis,
  author = {Man\c{c}ano, Tales},
  title  = {Inequality in Access to Tertiary Education in Brazil: Household
            Incomes, Reforming Policies, and the Politics of Who Gets In
            (1990s--2020s)},
  school = {University of S\~{a}o Paulo},
  year   = {2026},
  type   = {Master's thesis},
  note   = {Unpublished; Graduate Program in Political Science}
}

@misc{Mancano2026_portas_renda_coortes_empilhado,
  author       = {Man\c{c}ano, Tales},
  title        = {Routes into tertiary education by per-capita income decile: The 2013 and 2020 secondary-school cohorts},
  year         = {2026},
  month        = sep,
  howpublished = {Open Data Analysis, \url{https://mancano-tales.github.io/open-data-analysis/posts/portas-renda-coortes-empilhado/}},
  note         = {Figure and reproducible pipeline. Source code: \url{https://github.com/mancano-tales/open-data-analysis}, folder posts/portas-renda-coortes-empilhado/. Accessed YYYY-MM-DD}
}
A permanent version (Git tag + Zenodo DOI) will be linked here once the dissertation is defended; until then, cite the page URL above and add the date you accessed it (source code: https://github.com/mancano-tales/open-data-analysis, folder posts/portas-renda-coortes-empilhado/).
Pipeline
The figure reads four aggregated tables redistributed in this post’s data/ folder, one per cohort and definition of entry. Each row is a count of students in a cell of income bracket (FAIXA_RENDA, A–Q) × household-size group (MORADORES_GRUPO) × route (COD_PORTA: 0 no entry, 1 public reserved seat, 2 public open competition, 3 ProUni, 4 FIES, 5 private without subsidy).
| Table | Cohort | Entry definition | SQL sent to SEDAP+ |
|---|---|---|---|
matriz_2013_fina_prouni_fies.csv |
2013 | any record (figure above) | sql/matriz_2013_fina_prouni_fies.sql |
matriz_2020_fina_prouni_fies.csv |
2020 | any record (figure above) | sql/matriz_2020_fina_prouni_fies.sql |
matriz_2013_fina_prouni_fies_com_in_matricula.csv |
2013 | IN_MATRICULA = 1 (earlier) |
sql/matriz_2013_fina_prouni_fies_com_in_matricula.sql |
matriz_2020_fina_prouni_fies_com_in_matricula.csv |
2020 | IN_MATRICULA = 1 (earlier) |
sql/matriz_2020_fina_prouni_fies_com_in_matricula.sql |
Each .sql file is the exact text sent to the SEDAP+ API, copied from the query log, with a header recording when it ran, the privacy parameters and the share of cells suppressed. To draw both figures from the tables:
plot.R— builds the per-capita income deciles and writes both figures tooutput/figures/portas-renda-coortes-empilhado/andoutput/figures/portas-renda-coortes-empilhado-in-matricula/— compare them with this post’sthumbnail.pngandthumbnail-in-matricula.png
To re-extract the tables from the linked microdata (requires an INEP SEDAP+ credential exported as SEDAP_TOKEN), run, from the project root:
shared-pipeline/sedap/010_SEDAP_Cliente.R— SEDAP+ API client, sourced by the script belowshared-pipeline/sedap/portas/031_Extrair_ProUni_FIES.R— builds and runs the queries for both cohorts and writesdata-raw/sedap/portas/matriz_<year>_fina_prouni_fies.csv; run it again withFILTRO_IN_MATRICULA=TRUEin the environment to reproduce the earlier definition. When these files exist,plot.Rreads them in preference to the redistributed copies
Reproducibility
Tier: B (redistributed aggregate) — the figure reproduces without credentials from the tables in data/; re-extraction requires SEDAP+ access.
The tables carry no individual record: each row is a count of students in a cell of income bracket × household-size group × route, as released by the platform after its own disclosure control. The extraction script only runs with an approved INEP credential; without one, its logic and the exact SQL remain available for audit.