Population Above Fixed Real Income Thresholds
Overview
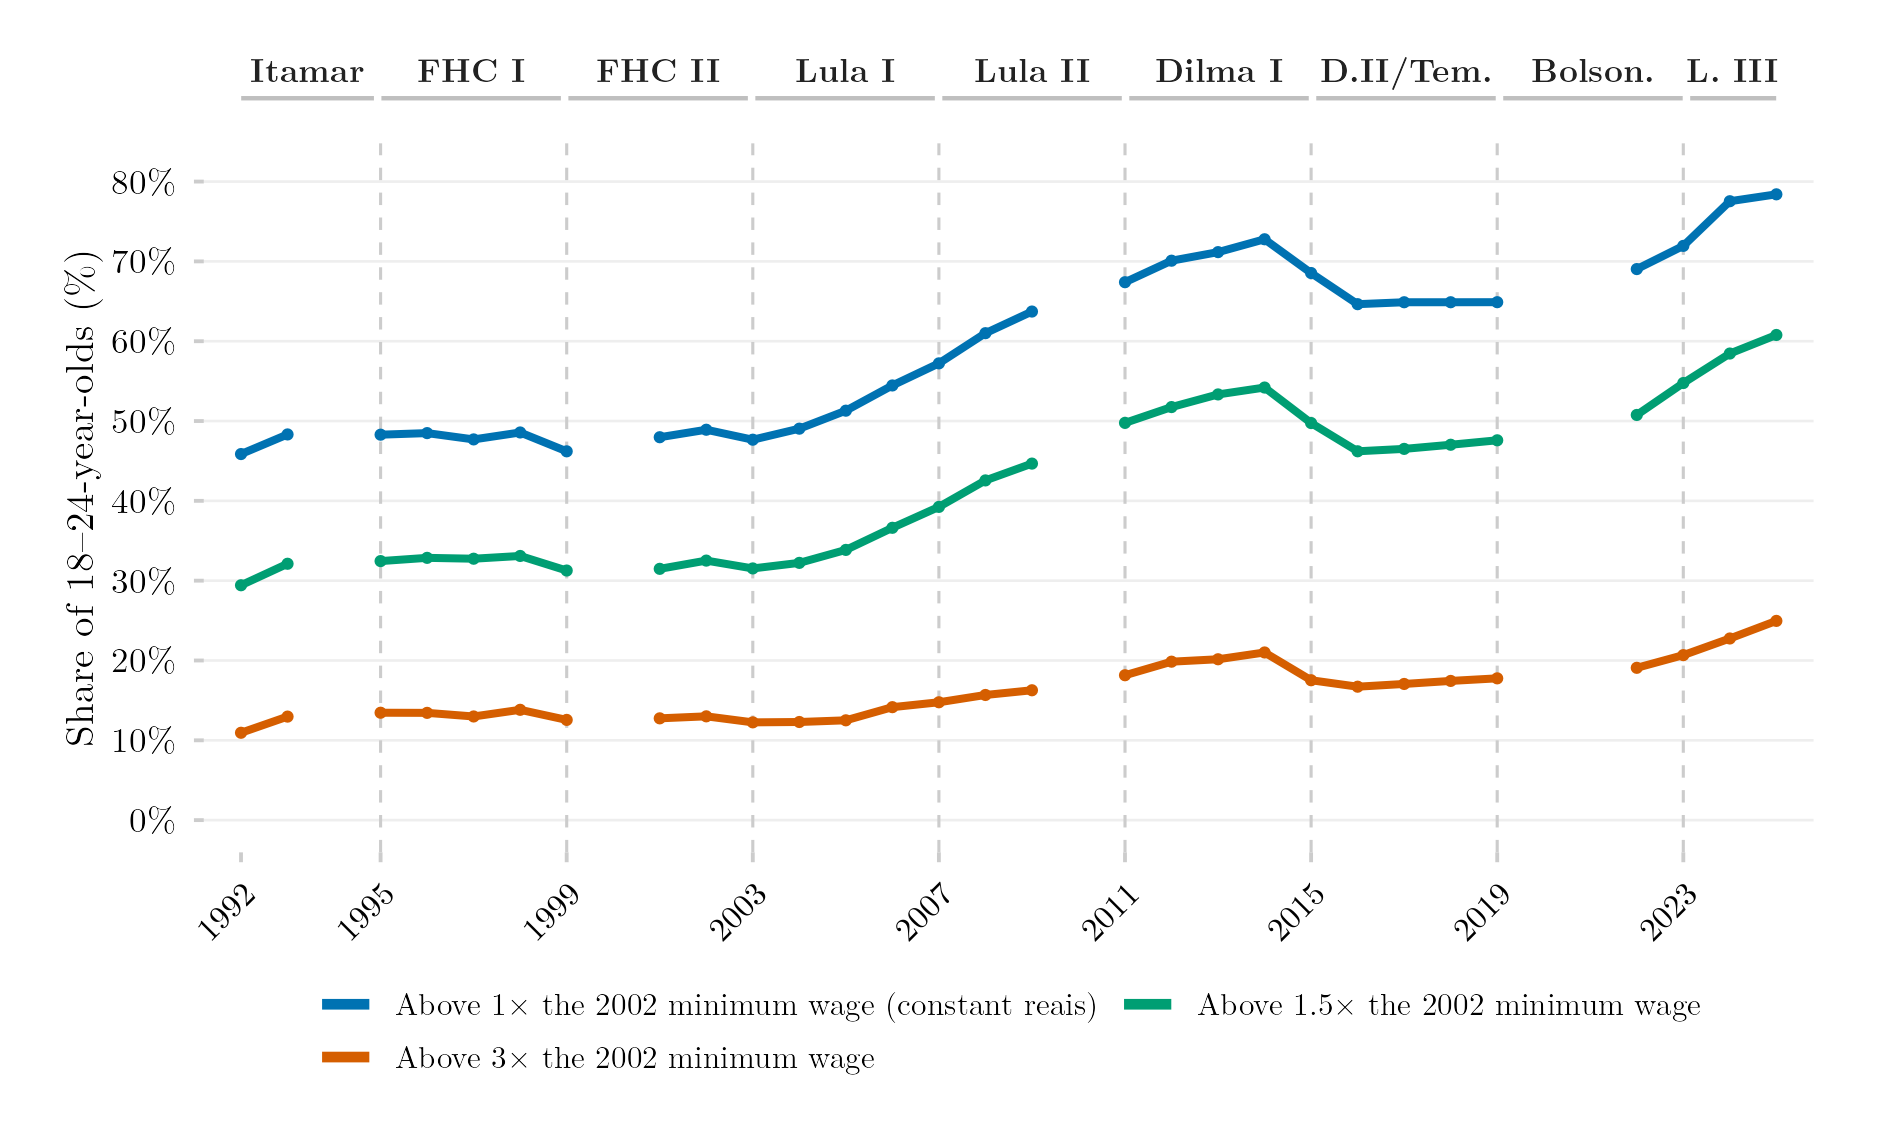
This figure shows how the share of young Brazilians living in households above fixed, purchasing-power-adjusted income thresholds changed over time. Instead of using a relative measure like income deciles (which always divide the population into fixed-size groups regardless of how income evolves), it fixes an absolute bar — a real income level expressed as multiples of the minimum wage — and tracks how many people cleared it each year.
Methodology
For each survey year, the minimum wage nominal value of January of that year (IPEADATA series MTE12_SALMIN12) is deflated to January-2024 prices via deflateBR::deflate(), and the January-2002 real value (R$675 in Jan.-2024 prices) is held fixed as the threshold for every subsequent year. Sampling-weighted shares of 18–24-year-olds with real per-capita household income at or above 1, 1.5, and 3 times that fixed threshold are computed year by year from the harmonized series (PNAD Anual through 2015, PNAD Contínua from 2016).
How to Cite
If you use this figure or the pipeline behind it, please cite both the dissertation and this specific analysis. References follow APA 7th edition.
Dissertation (in preparation; the entry will be updated after the defense):
Mançano, T. (2026). Inequality in access to tertiary education in Brazil: Household incomes, reforming policies, and the politics of who gets in (1990s–2020s) [Unpublished master’s thesis]. University of São Paulo.
This figure and pipeline:
Mançano, T. (2026, August 9). Population above fixed real income thresholds [Figure and reproducible pipeline]. Open Data Analysis. https://mancano-tales.github.io/open-data-analysis/posts/populacao-limiares-sm/
In text: (Mançano, 2026) — when citing several analyses from this catalog in the same work, APA distinguishes them as 2026a, 2026b, … in the order they appear in the reference list.
BibTeX:
@mastersthesis{Mancano2026Thesis,
  author = {Man\c{c}ano, Tales},
  title  = {Inequality in Access to Tertiary Education in Brazil: Household
            Incomes, Reforming Policies, and the Politics of Who Gets In
            (1990s--2020s)},
  school = {University of S\~{a}o Paulo},
  year   = {2026},
  type   = {Master's thesis},
  note   = {Unpublished; Graduate Program in Political Science}
}

@misc{Mancano2026_populacao_limiares_sm,
  author       = {Man\c{c}ano, Tales},
  title        = {Population above fixed real income thresholds},
  year         = {2026},
  month        = aug,
  howpublished = {Open Data Analysis, \url{https://mancano-tales.github.io/open-data-analysis/posts/populacao-limiares-sm/}},
  note         = {Figure and reproducible pipeline. Source code: \url{https://github.com/mancano-tales/open-data-analysis}, folder posts/populacao-limiares-sm/. Accessed YYYY-MM-DD}
}
A permanent version (Git tag + Zenodo DOI) will be linked here once the dissertation is defended; until then, cite the page URL above and add the date you accessed it (source code: https://github.com/mancano-tales/open-data-analysis, folder posts/populacao-limiares-sm/).
Pipeline
This figure draws on the PNAD / PNAD Contínua Harmonization, 1992–2025 panel.
Run these scripts in this order, from the project root (each one writes to data-raw/, which the next one reads):
shared-pipeline/pnadc/000_PNADC_Download_Consolidate.R— downloads PNAD Contínua 2012–2025 (1st interview) withPNADcIBGE::get_pnadc()intodata-raw/pnadc_raw/and consolidates it intodata-raw/pnadc_consolidado_2012_2025_interview1.rdsshared-pipeline/pnadc/020_PNAD_Anual_Manual_Import_2001_2015.R— downloads the PNAD Anual 2001–2015 microdata from the IBGE FTP intodata-raw/pnad_anual_raw/and imports them intodata-raw/harmonizing-br-data/output/PNAD_Anual_2001_2015.parquetshared-pipeline/pnadc/050_PNAD_Historica_Manual_Import_1992_1999.R— same for PNAD Anual 1992–1999 (PNAD_Anual_1992_1999.parquet)shared-pipeline/pnadc/035_Splice_Microdados.R— splices PNAD Anual and PNAD Contínua into the harmonized panel —Microdados_Todas_Idades_1992_2025.parquetandMicrodados_Jovens_18_24_1992_2025.parquetindata-raw/harmonizing-br-data/output/(sourcesshared-pipeline/utils/codigos_curso_pnad.R)plot.R— readsMicrodados_Jovens_18_24_1992_2025.parquet; the minimum-wage series is fetched online from IPEADATA (ipeadatar) on first run; writes the figure tooutput/figures/populacao-limiares-sm/— compare it with this post’sthumbnail.png
All of the upstream steps above are Tier A and are also run, in this same order, by shared-pipeline/build_public_data.R.
Reproducibility
Tier: A
This pipeline uses only public data, accessible via package/API without any credential (PNADcIBGE, censobr, sidrar, ipeadatar). Run the scripts in shared-pipeline/ in numeric order to reconstruct the intermediate data.