Tuition Burden Relative to Household Income by Income Decile
Overview
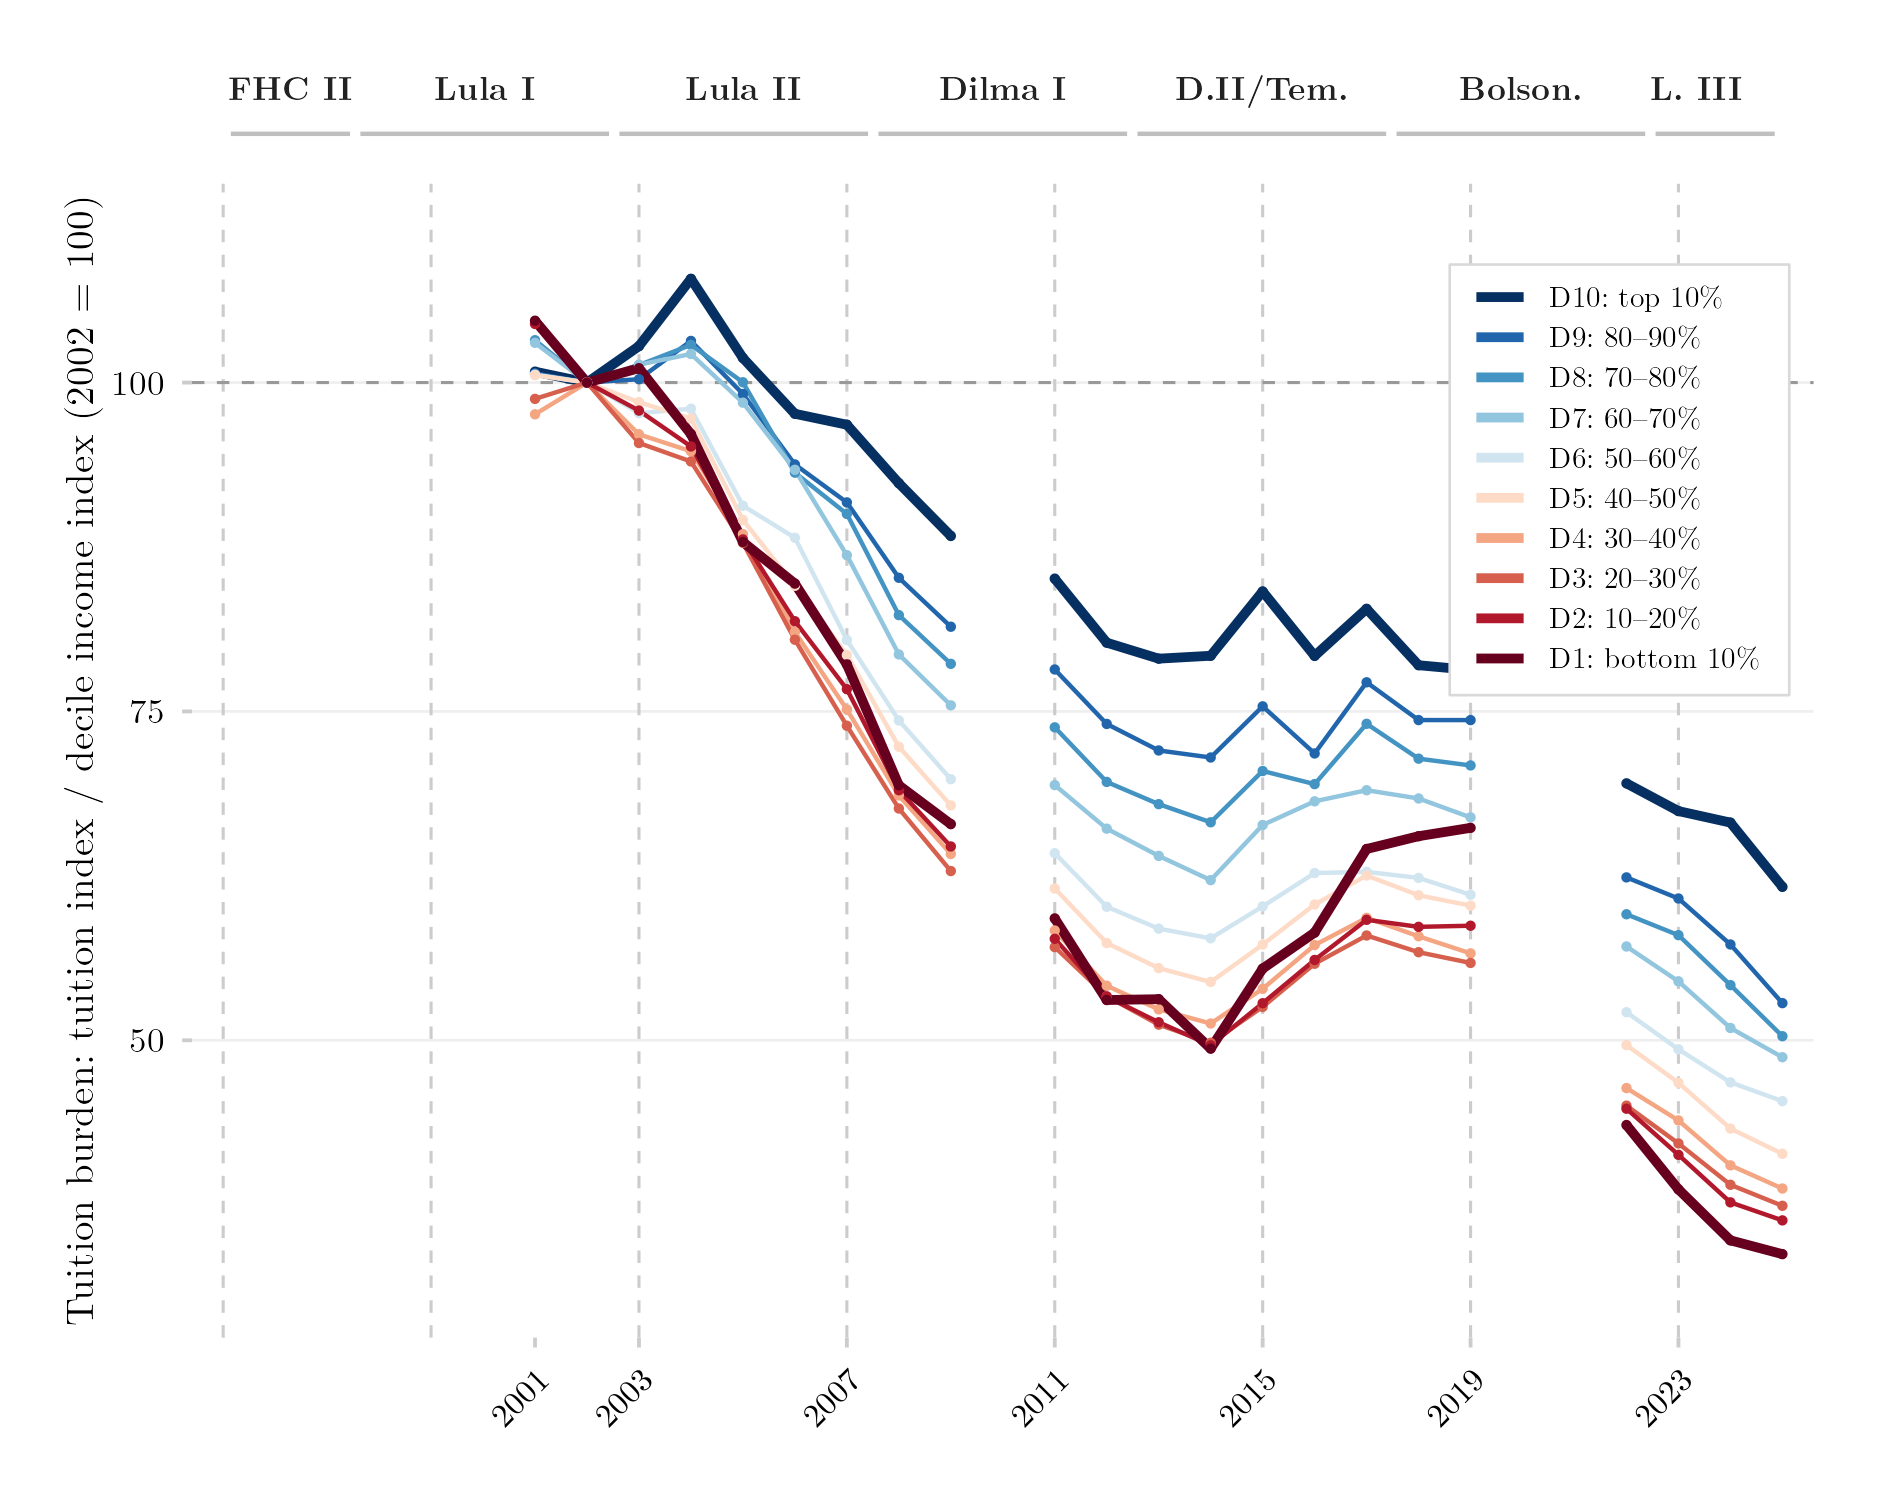
This figure asks whether the same nominal tuition bill became easier or harder to afford for households at different points in the income distribution. It combines the higher-education tuition price series with household income by decile, tracking how the ratio between the two moved for the poorest and richest deciles since 2002.
Methodology
The tuition-burden index divides the same real tuition-readjustment series used in the IPCA tuition figure by the weighted mean real per-capita household income of each decile, both expressed as 2002 = 100 and both deflated by the same IPCA base. Deciles are computed within each survey year and source; the harmonized series uses PNAD Anual through 2015 and PNAD Contínua from 2016 onward, with 2012–2015 restricted to PNAD Anual observations. Because the burden is a ratio of two indices anchored at the same base year, it says nothing about the absolute affordability of tuition in any single year — only about how a fixed nominal bill moved relative to each decile’s own income trajectory since 2002. The underlying tuition series is a fixed-panel readjustment index and does not register the additional compositional cheapening from the post-2015 migration toward distance learning, so the burden shown is, if anything, an upper bound on how much lighter the bill became for lower deciles.
How to Cite
If you use this figure or the pipeline behind it, please cite both the dissertation and this specific analysis. References follow APA 7th edition.
Dissertation (in preparation; the entry will be updated after the defense):
Mançano, T. (2026). Inequality in access to tertiary education in Brazil: Household incomes, reforming policies, and the politics of who gets in (1990s–2020s) [Unpublished master’s thesis]. University of São Paulo.
This figure and pipeline:
Mançano, T. (2026, August 9). Tuition burden relative to household income by income decile [Figure and reproducible pipeline]. Open Data Analysis. https://mancano-tales.github.io/open-data-analysis/posts/fardo-mensalidade-decil/
In text: (Mançano, 2026) — when citing several analyses from this catalog in the same work, APA distinguishes them as 2026a, 2026b, … in the order they appear in the reference list.
BibTeX:
@mastersthesis{Mancano2026Thesis,
  author = {Man\c{c}ano, Tales},
  title  = {Inequality in Access to Tertiary Education in Brazil: Household
            Incomes, Reforming Policies, and the Politics of Who Gets In
            (1990s--2020s)},
  school = {University of S\~{a}o Paulo},
  year   = {2026},
  type   = {Master's thesis},
  note   = {Unpublished; Graduate Program in Political Science}
}

@misc{Mancano2026_fardo_mensalidade_decil,
  author       = {Man\c{c}ano, Tales},
  title        = {Tuition burden relative to household income by income decile},
  year         = {2026},
  month        = aug,
  howpublished = {Open Data Analysis, \url{https://mancano-tales.github.io/open-data-analysis/posts/fardo-mensalidade-decil/}},
  note         = {Figure and reproducible pipeline. Source code: \url{https://github.com/mancano-tales/open-data-analysis}, folder posts/fardo-mensalidade-decil/. Accessed YYYY-MM-DD}
}
A permanent version (Git tag + Zenodo DOI) will be linked here once the dissertation is defended; until then, cite the page URL above and add the date you accessed it (source code: https://github.com/mancano-tales/open-data-analysis, folder posts/fardo-mensalidade-decil/).
Pipeline
This figure draws on the PNAD / PNAD Contínua Harmonization, 1992–2025 panel.
Run these scripts in this order, from the project root (each one writes to data-raw/, which the next one reads):
shared-pipeline/pnadc/000_PNADC_Download_Consolidate.R— downloads PNAD Contínua 2012–2025 (1st interview) withPNADcIBGE::get_pnadc()intodata-raw/pnadc_raw/and consolidates it intodata-raw/pnadc_consolidado_2012_2025_interview1.rdsshared-pipeline/pnadc/020_PNAD_Anual_Manual_Import_2001_2015.R— downloads the PNAD Anual 2001–2015 microdata from the IBGE FTP intodata-raw/pnad_anual_raw/and imports them intodata-raw/harmonizing-br-data/output/PNAD_Anual_2001_2015.parquetshared-pipeline/pnadc/050_PNAD_Historica_Manual_Import_1992_1999.R— same for PNAD Anual 1992–1999 (PNAD_Anual_1992_1999.parquet)shared-pipeline/pnadc/035_Splice_Microdados.R— splices PNAD Anual and PNAD Contínua into the harmonized panel —Microdados_Todas_Idades_1992_2025.parquetandMicrodados_Jovens_18_24_1992_2025.parquetindata-raw/harmonizing-br-data/output/(sourcesshared-pipeline/utils/codigos_curso_pnad.R)shared-pipeline/ipca/010_IPCA_Curso_Superior_Series.R— downloads the IPCA tuition sub-item and minimum-wage series (SIDRA / IPEADATA) and writesdata-raw/ipca-mensalidades/output/serie_mensalidade_mensal.rdsplot.R— readsMicrodados_Todas_Idades_1992_2025.parquetandserie_mensalidade_mensal.rds; writes the figure tooutput/figures/fardo-mensalidade-decil/— compare it with this post’sthumbnail.png
All of the upstream steps above are Tier A and are also run, in this same order, by shared-pipeline/build_public_data.R.
Reproducibility
Tier: A
This pipeline uses only public data, accessible via package/API without any credential (PNADcIBGE, censobr, sidrar, ipeadatar). Run the scripts in shared-pipeline/ in numeric order to reconstruct the intermediate data.