Grade Progression Ratio (GDR6) in São Paulo and Bahia
Overview
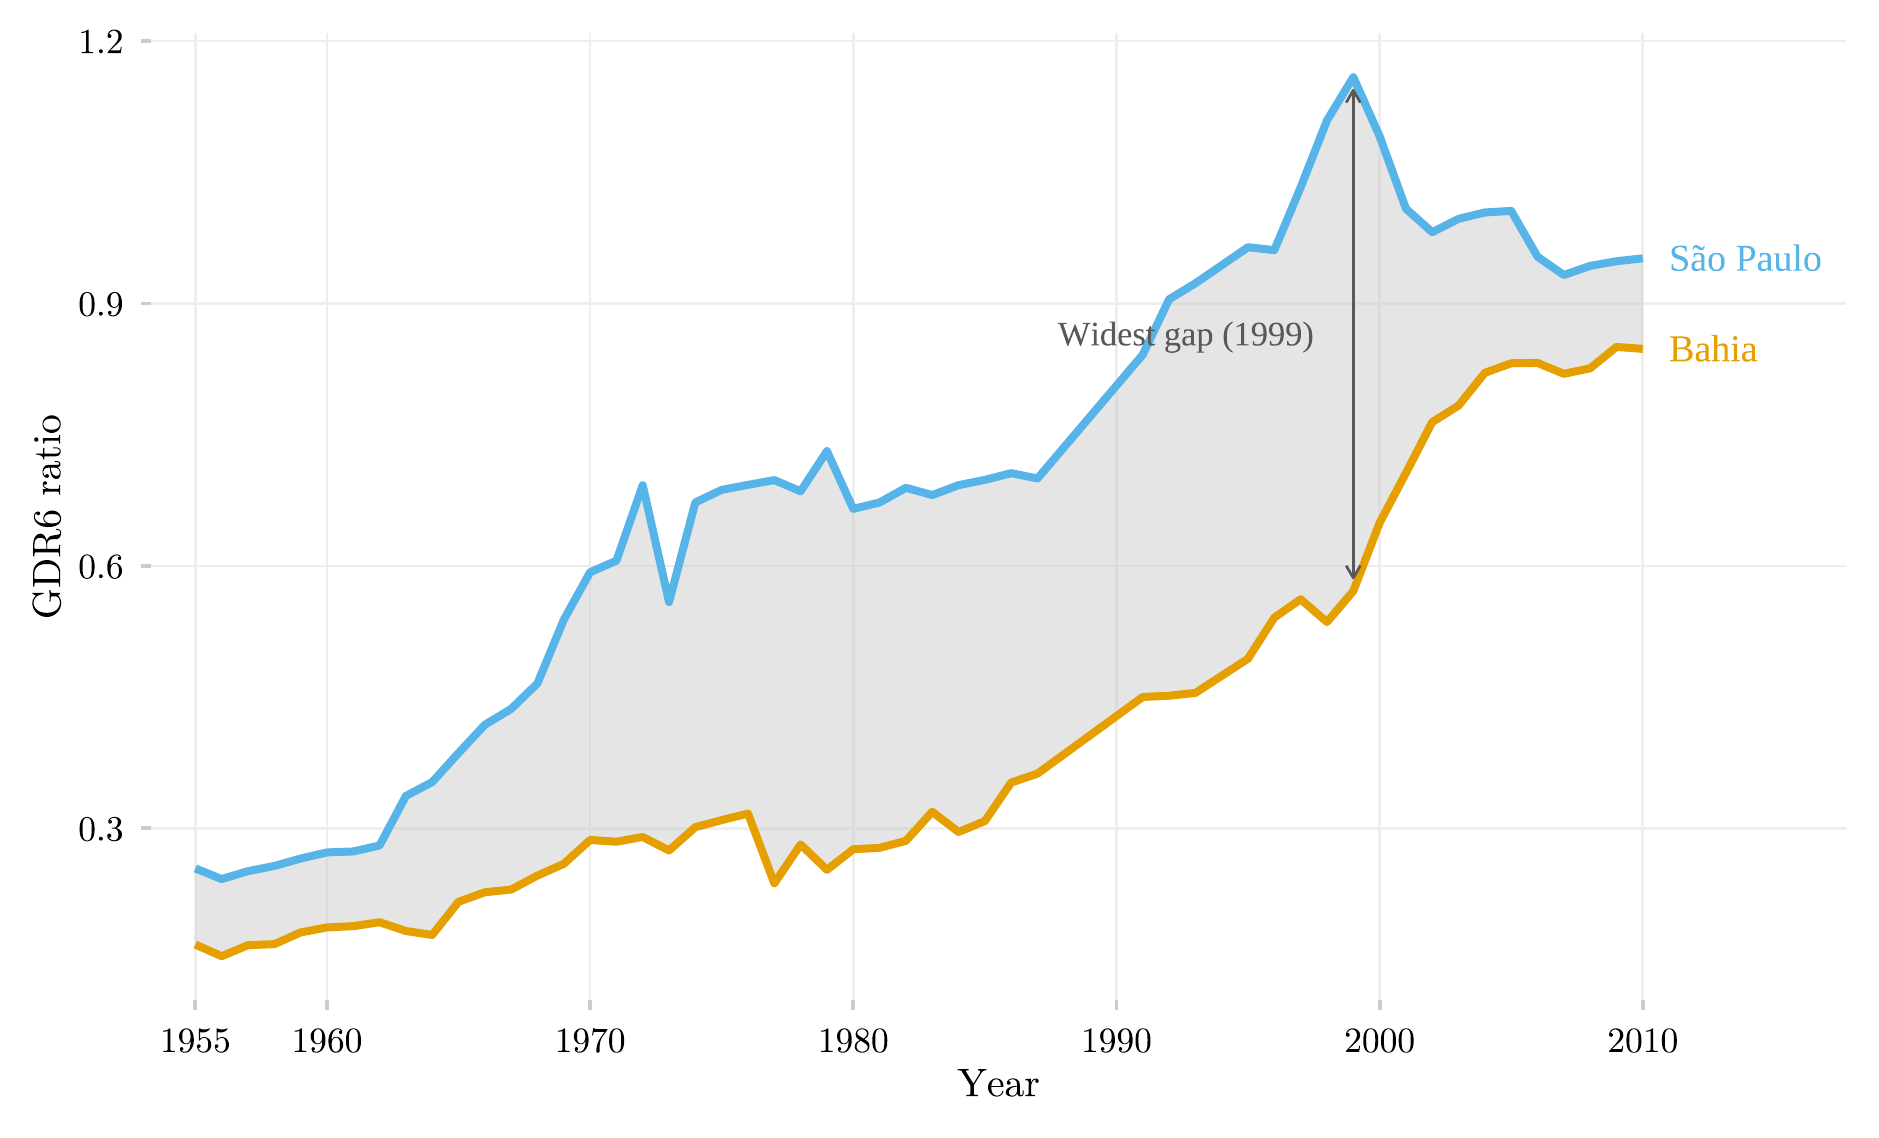
This figure compares two Brazilian states, São Paulo and Bahia, on how well children progressed through the early grades of primary school, from 1955 to 2010. It shows a large and persistent regional gap in basic education that narrows only after reforms in the 1990s — long before either state’s population would reach the tertiary-education pipelines examined elsewhere in this catalog.
Methodology
GDR6 proxies early-primary retention: enrollment in grades 4–6 relative to grades 1–3. The grey band is the São Paulo–Bahia gap; it widens through the developmentalist decades and only narrows substantially after the 1990s reforms, tracing half a century of regional educational inequality in a single band.
How to Cite
If you use this figure or the pipeline behind it, please cite both the dissertation and this specific analysis. References follow APA 7th edition.
Dissertation (in preparation; the entry will be updated after the defense):
Mançano, T. (2026). Inequality in access to tertiary education in Brazil: Household incomes, reforming policies, and the politics of who gets in (1990s–2020s) [Unpublished master’s thesis]. University of São Paulo.
This figure and pipeline:
Mançano, T. (2026, July 12). Grade progression ratio (GDR6) in São Paulo and Bahia [Figure and reproducible pipeline]. Open Data Analysis. https://mancano-tales.github.io/open-data-analysis/posts/educabr2-progression-gdr6/
In text: (Mançano, 2026) — when citing several analyses from this catalog in the same work, APA distinguishes them as 2026a, 2026b, … in the order they appear in the reference list.
BibTeX:
@mastersthesis{Mancano2026Thesis,
  author = {Man\c{c}ano, Tales},
  title  = {Inequality in Access to Tertiary Education in Brazil: Household
            Incomes, Reforming Policies, and the Politics of Who Gets In
            (1990s--2020s)},
  school = {University of S\~{a}o Paulo},
  year   = {2026},
  type   = {Master's thesis},
  note   = {Unpublished; Graduate Program in Political Science}
}

@misc{Mancano2026_educabr2_progression_gdr6,
  author       = {Man\c{c}ano, Tales},
  title        = {Grade progression ratio (GDR6) in S\~{a}o Paulo and Bahia},
  year         = {2026},
  month        = jul,
  howpublished = {Open Data Analysis, \url{https://mancano-tales.github.io/open-data-analysis/posts/educabr2-progression-gdr6/}},
  note         = {Figure and reproducible pipeline. Source code: \url{https://github.com/mancano-tales/open-data-analysis}, folder posts/educabr2-progression-gdr6/. Accessed YYYY-MM-DD}
}
A permanent version (Git tag + Zenodo DOI) will be linked here once the dissertation is defended; until then, cite the page URL above and add the date you accessed it (source code: https://github.com/mancano-tales/open-data-analysis, folder posts/educabr2-progression-gdr6/).
Pipeline
Scripts for this analysis:
Reproducibility
Tier: A (cross-repo)
This pipeline depends on the public R package educabr2 (remotes::install_github("mancano-tales/educabr2")), which already embeds the necessary data.