Tertiary Education Enrollment in Brazil: Harmonized Series and Competing Sources
Overview
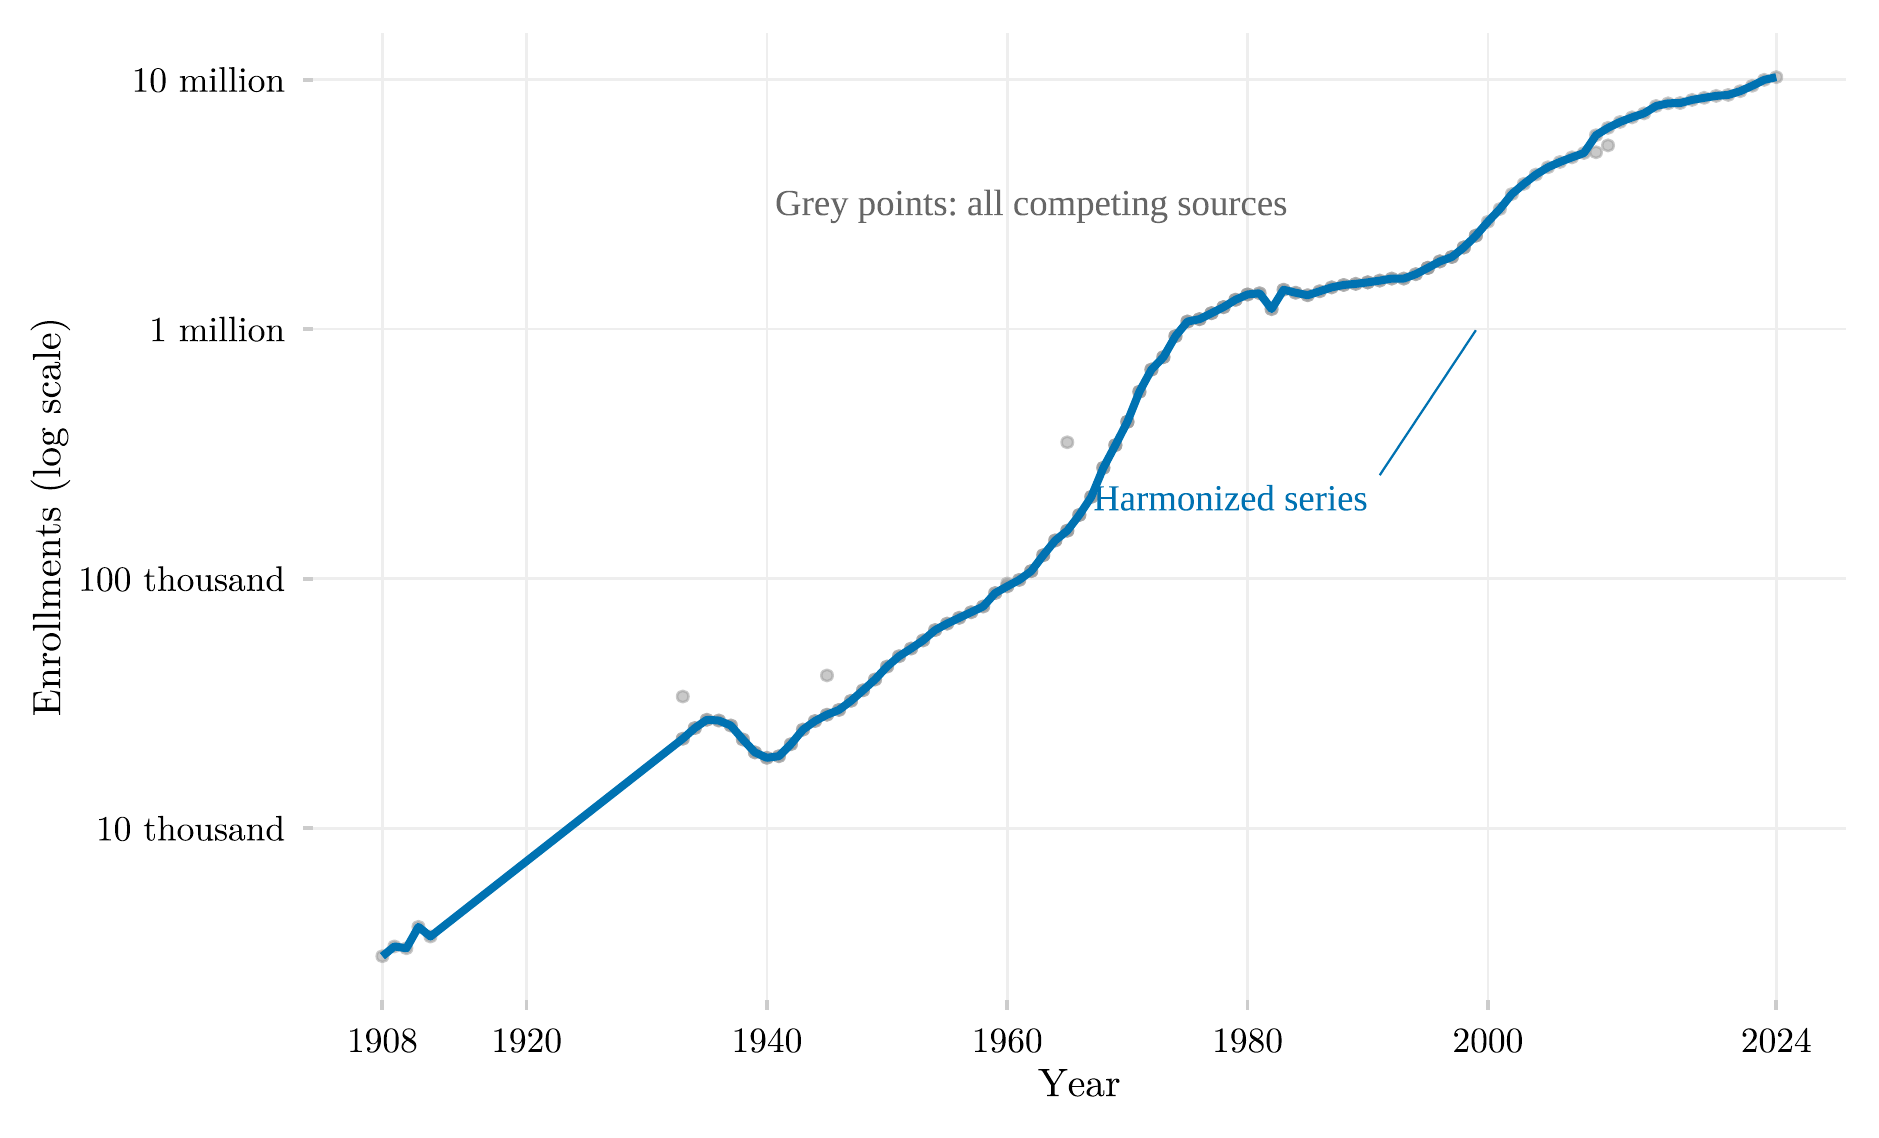
This figure traces the growth of tertiary education enrollment in Brazil across more than a century, from 1907 to 2024, on a logarithmic scale. It overlays a single harmonized series against every competing historical estimate available, letting the reader see directly where sources agree and where they diverge, rather than taking the harmonization on faith.
Methodology
The blue line splices six data sources using the educabr2 package’s deduplication hierarchy, in which the most disaggregated official source wins wherever sources overlap for the same year; grey points show every competing estimate from the underlying sources. Plotting both together makes the cross-source agreement, and the few divergent stretches, directly visible. The vertical axis is logarithmic: enrollment grew roughly a thousandfold across the century.
How to Cite
If you use this figure or the pipeline behind it, please cite both the dissertation and this specific analysis. References follow APA 7th edition.
Dissertation (in preparation; the entry will be updated after the defense):
Mançano, T. (2026). Inequality in access to tertiary education in Brazil: Household incomes, reforming policies, and the politics of who gets in (1990s–2020s) [Unpublished master’s thesis]. University of São Paulo.
This figure and pipeline:
Mançano, T. (2026, July 12). Tertiary education enrollment in Brazil: Harmonized series and competing sources [Figure and reproducible pipeline]. Open Data Analysis. https://mancano-tales.github.io/open-data-analysis/posts/educabr2-enrollment-sources/
In text: (Mançano, 2026) — when citing several analyses from this catalog in the same work, APA distinguishes them as 2026a, 2026b, … in the order they appear in the reference list.
BibTeX:
@mastersthesis{Mancano2026Thesis,
  author = {Man\c{c}ano, Tales},
  title  = {Inequality in Access to Tertiary Education in Brazil: Household
            Incomes, Reforming Policies, and the Politics of Who Gets In
            (1990s--2020s)},
  school = {University of S\~{a}o Paulo},
  year   = {2026},
  type   = {Master's thesis},
  note   = {Unpublished; Graduate Program in Political Science}
}

@misc{Mancano2026_educabr2_enrollment_sources,
  author       = {Man\c{c}ano, Tales},
  title        = {Tertiary education enrollment in Brazil: Harmonized series and competing sources},
  year         = {2026},
  month        = jul,
  howpublished = {Open Data Analysis, \url{https://mancano-tales.github.io/open-data-analysis/posts/educabr2-enrollment-sources/}},
  note         = {Figure and reproducible pipeline. Source code: \url{https://github.com/mancano-tales/open-data-analysis}, folder posts/educabr2-enrollment-sources/. Accessed YYYY-MM-DD}
}
A permanent version (Git tag + Zenodo DOI) will be linked here once the dissertation is defended; until then, cite the page URL above and add the date you accessed it (source code: https://github.com/mancano-tales/open-data-analysis, folder posts/educabr2-enrollment-sources/).
Pipeline
Scripts for this analysis:
Reproducibility
Tier: A (cross-repo)
This pipeline depends on the public R package educabr2 (remotes::install_github("mancano-tales/educabr2")), which already embeds the necessary data.