Household Income Distribution by Higher Education Sector
Overview
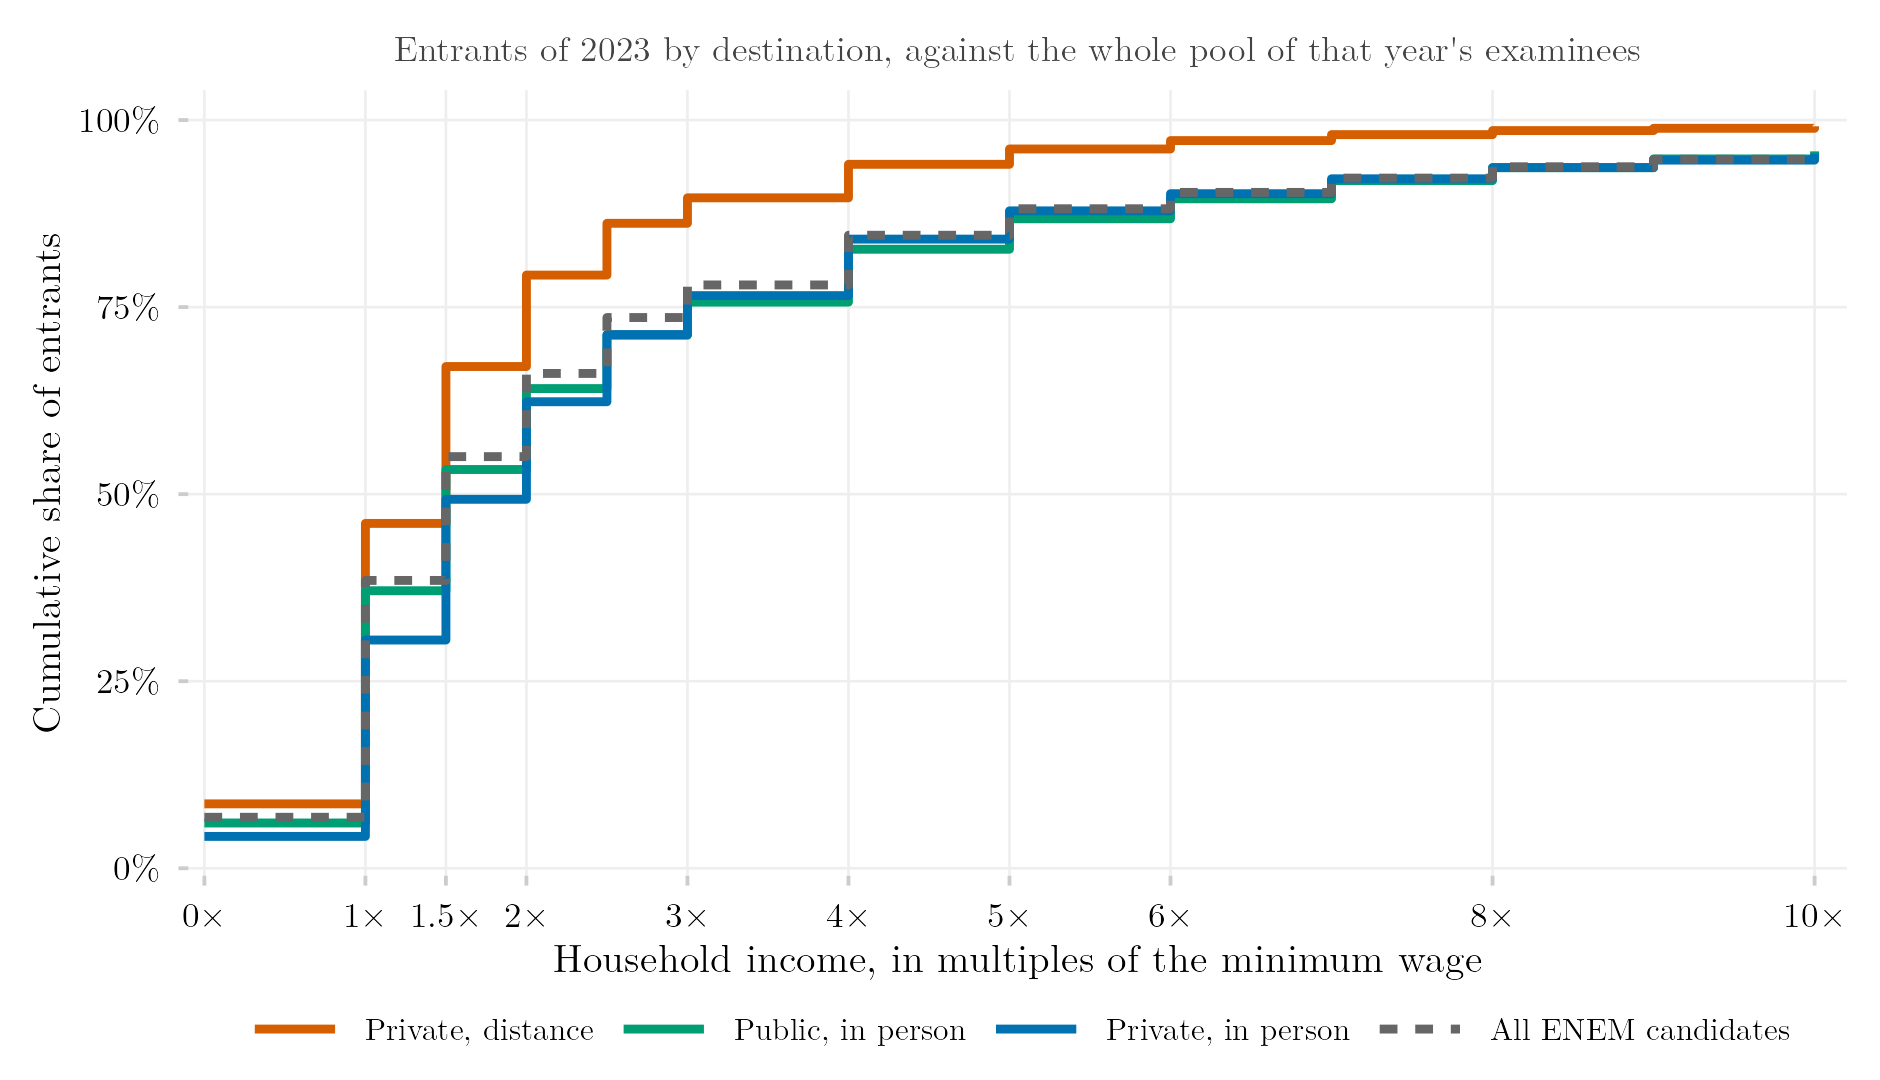
This figure shows the household income distribution of students entering each higher-education sector, benchmarked not against the general population but against everyone who sat the same national college-entrance exam in that cohort. This lets it show whether a sector draws disproportionately from higher- or lower-income applicants relative to the pool of people actually competing for a seat, rather than only relative to society at large.
Methodology
Income distribution of entrants (linked ENEM×Census records) by sector, benchmarked against the full pool of ENEM (Brazil’s national high-school exam) examinees in the same cohort — i.e., against everyone who took the exam, not just those who enrolled. This lets the figure show whether a sector’s entering class is income-skewed relative to the applicant pool it draws from, rather than only relative to the general population.
How to Cite
If you use this figure or the pipeline behind it, please cite both the dissertation and this specific analysis. References follow APA 7th edition.
Dissertation (in preparation; the entry will be updated after the defense):
Mançano, T. (2026). Inequality in access to tertiary education in Brazil: Household incomes, reforming policies, and the politics of who gets in (1990s–2020s) [Unpublished master’s thesis]. University of São Paulo.
This figure and pipeline:
Mançano, T. (2026, August 6). Household income distribution by higher education sector [Figure and reproducible pipeline]. Open Data Analysis. https://mancano-tales.github.io/open-data-analysis/posts/distribuicao-renda-setor/
In text: (Mançano, 2026) — when citing several analyses from this catalog in the same work, APA distinguishes them as 2026a, 2026b, … in the order they appear in the reference list.
BibTeX:
@mastersthesis{Mancano2026Thesis,
  author = {Man\c{c}ano, Tales},
  title  = {Inequality in Access to Tertiary Education in Brazil: Household
            Incomes, Reforming Policies, and the Politics of Who Gets In
            (1990s--2020s)},
  school = {University of S\~{a}o Paulo},
  year   = {2026},
  type   = {Master's thesis},
  note   = {Unpublished; Graduate Program in Political Science}
}

@misc{Mancano2026_distribuicao_renda_setor,
  author       = {Man\c{c}ano, Tales},
  title        = {Household income distribution by higher education sector},
  year         = {2026},
  month        = aug,
  howpublished = {Open Data Analysis, \url{https://mancano-tales.github.io/open-data-analysis/posts/distribuicao-renda-setor/}},
  note         = {Figure and reproducible pipeline. Source code: \url{https://github.com/mancano-tales/open-data-analysis}, folder posts/distribuicao-renda-setor/. Accessed YYYY-MM-DD}
}
A permanent version (Git tag + Zenodo DOI) will be linked here once the dissertation is defended; until then, cite the page URL above and add the date you accessed it (source code: https://github.com/mancano-tales/open-data-analysis, folder posts/distribuicao-renda-setor/).
Pipeline
Run these scripts in this order, from the project root (each one writes to data-raw/, which the next one reads):
shared-pipeline/sedap/010_SEDAP_Cliente.R— SEDAP+ API client, sourced by the script below — requires theSEDAP_TOKENenvironment variableshared-pipeline/sedap/070_Perfil_Renda_Modalidade.R— extracts the income profile of entrants by modality from SEDAP+ and writesdata-raw/sedap/extraido_perfil_renda_modalidade_2014_2024.csvplot.R— readsdata-raw/sedap/extraido_perfil_renda_modalidade_2014_2024.csv; writes the figure tooutput/figures/distribuicao-renda-setor/— compare it with this post’sthumbnail.png
The SEDAP+ steps only run with an approved INEP credential exported as SEDAP_TOKEN (see Reproducibility below); the extracted CSV is not redistributed here.
Reproducibility
Tier: B
This pipeline depends on restricted INEP data accessible via SEDAP+ credentials (SEDAP_TOKEN environment variable). Without an approved credential, the scripts in shared-pipeline/sedap/ will not run — the logic remains available for audit, but full reproduction requires requesting access.