Income Inequality and Real Income Growth by Decile (Gini/Palma Panel)
Overview
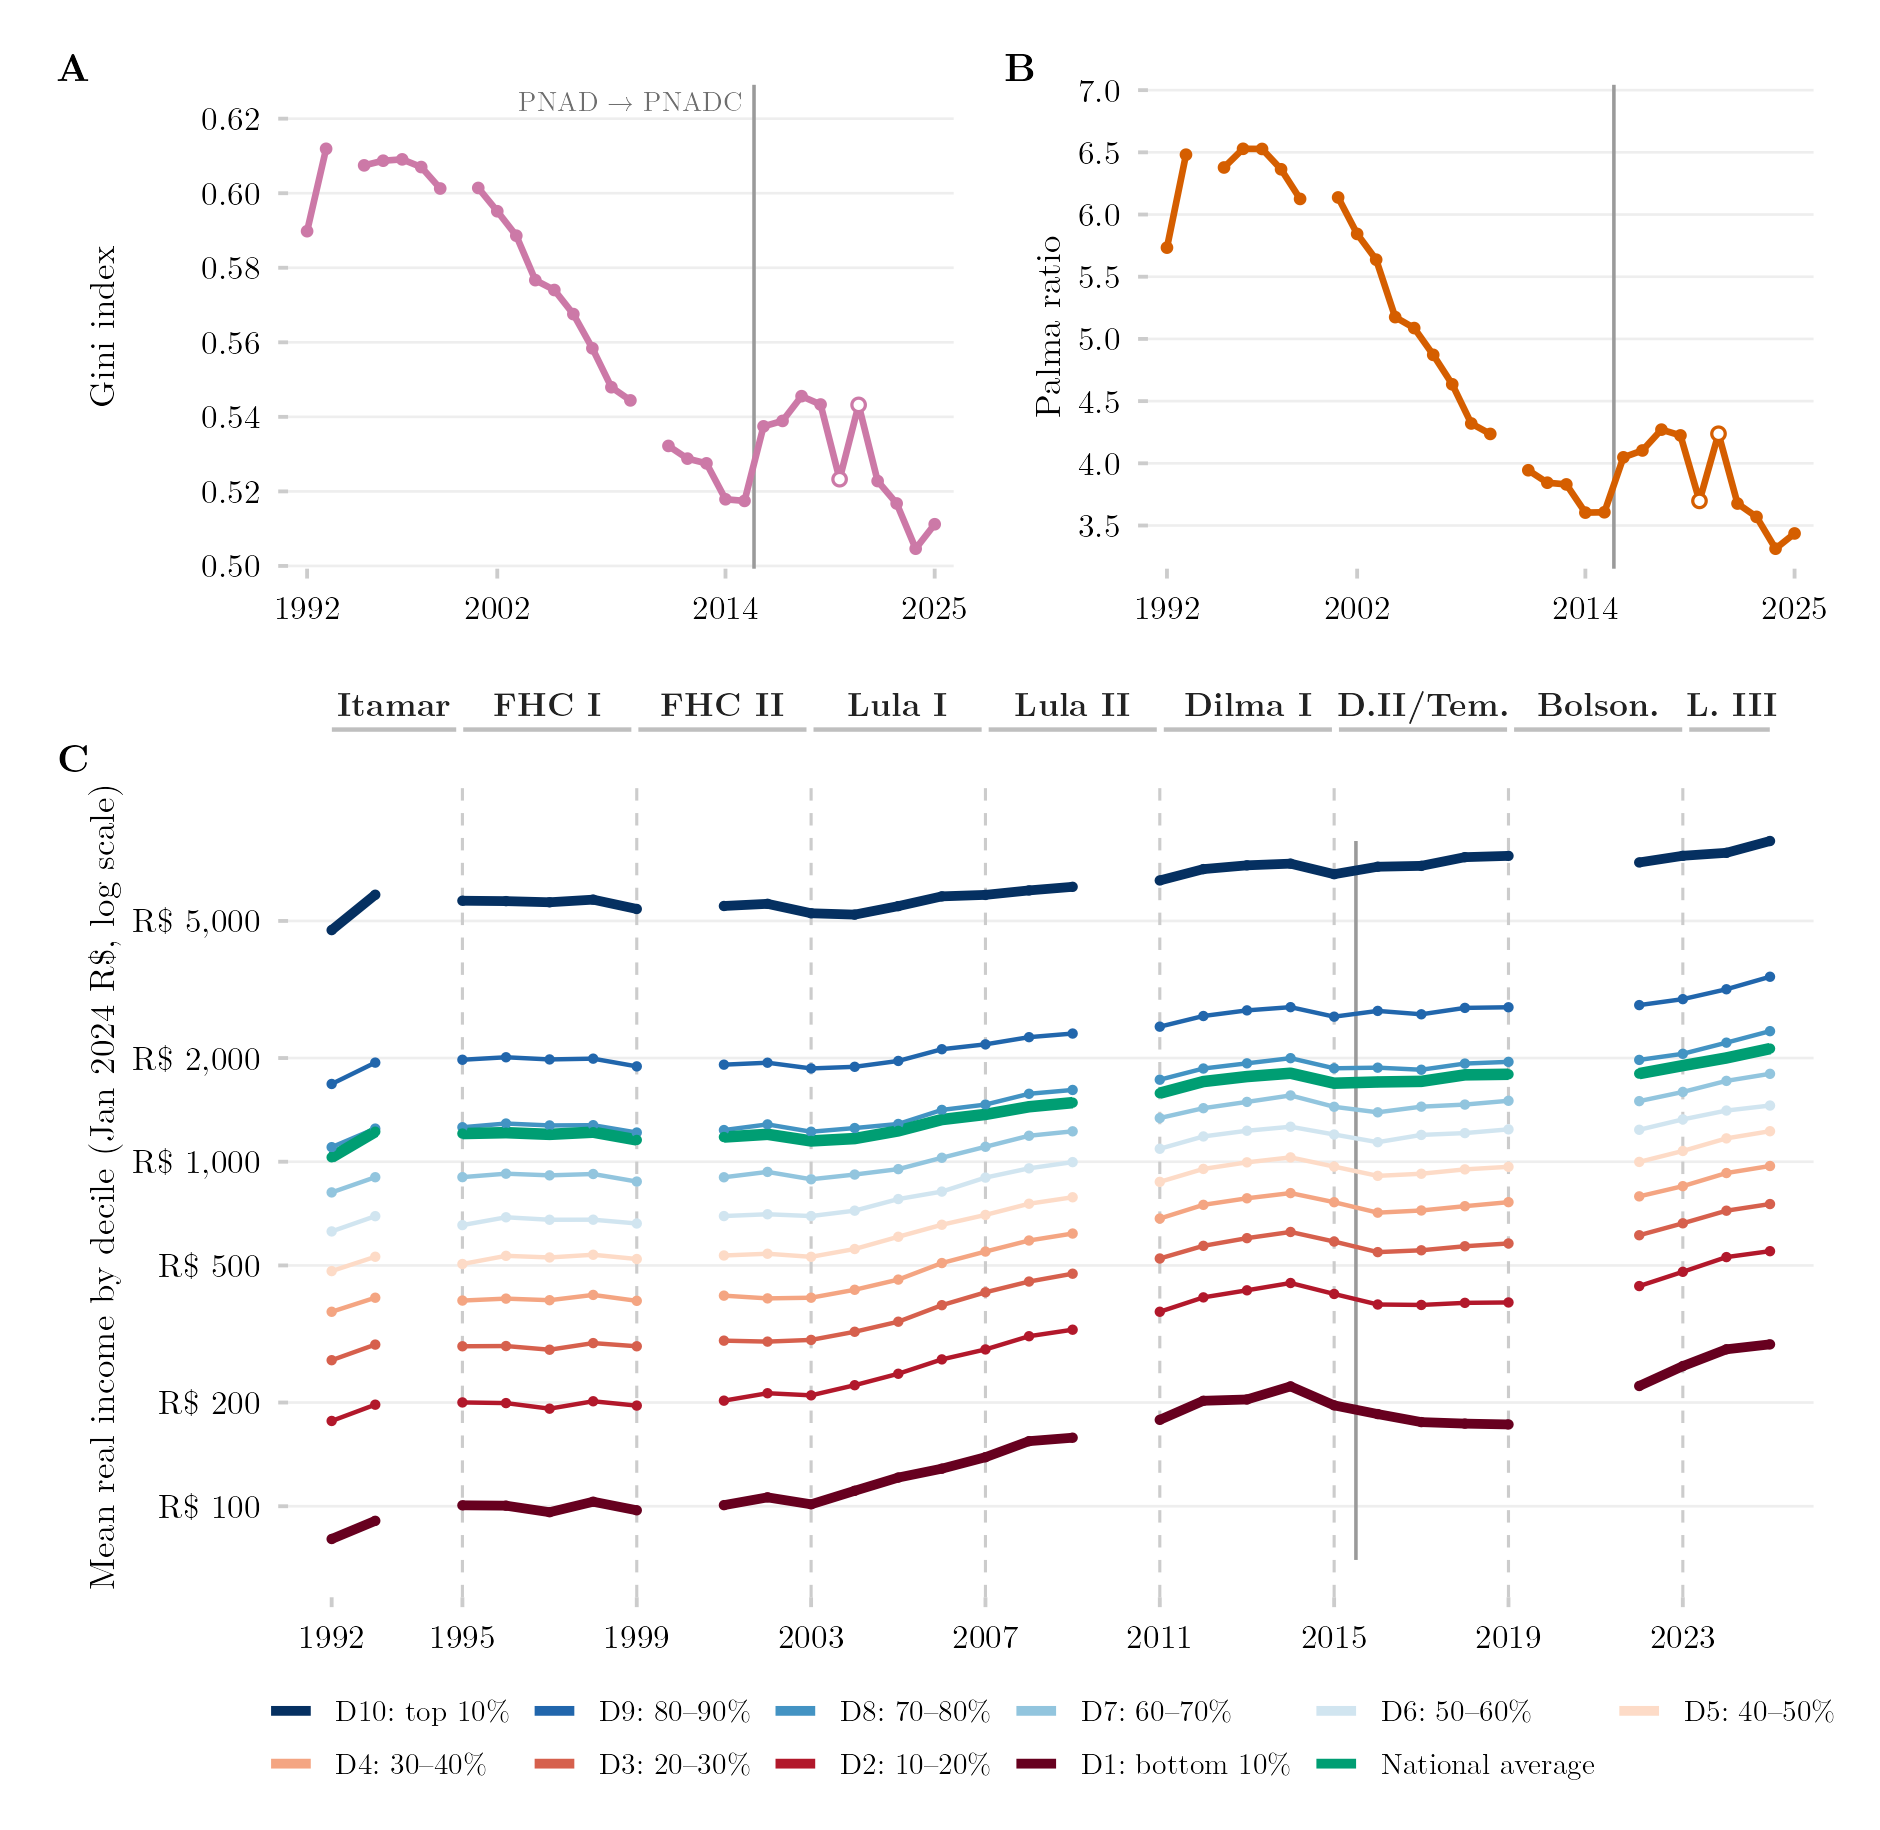
This figure combines three views of Brazilian income inequality from 1992 to 2024: (A) the Gini index, a standard scalar summary of overall inequality; (B) the Palma ratio, comparing the income share of the richest tenth against the poorest 40%; and (C) the actual trajectory of mean real income for each individual decile, on a logarithmic scale. Together they move from a single summary number down to the full anatomy of who gained and who fell behind.
Methodology
Panel A shows the Gini index of real per-capita income. Panel B shows the Palma ratio — the income share of the richest decile divided by that of the poorest four deciles. Panels A and B follow the official universe, which retains households reporting no income, and reproduce IBGE’s own published series (mean deviation −0.0001). Panel C shows mean real per-capita income by decile, in January-2024 reais, on a logarithmic axis; here the deciles rest on the working universe of positive incomes only, so panel C’s levels are not strictly the official ones. Lines are interrupted in years without a survey (1994, 2000, 2010, 2020–2021); hollow markers in panels A and B mark 2020 and 2021, taken from the telephone-collected fifth visit of PNAD Contínua. The income unit is the family up to 2015 (PNAD) and the household from 2016 onward (PNAD Contínua); the two coincide except where several families share a dwelling, and a solid vertical rule marks that change of source. Because both surveys ran in 2012–2015, the effect of the instrument change can be measured directly rather than assumed: for the same year, PNAD Contínua returns a Gini index higher by 0.008 and a Palma ratio higher by 0.15 on average. Of the step observed between 2015 and 2016 (+0.020 Gini, +0.44 Palma), roughly a third is therefore an artefact of the survey splice rather than a genuine rise in inequality. This vertical rule is distinct from the dashed rules in panel C, which mark changes of government; the 2015–2019 government block joins Dilma Rousseff’s second term to Michel Temer’s, so the August-2016 impeachment does not appear as a boundary in the figure.
How to Cite
If you use this figure or the pipeline behind it, please cite both the dissertation and this specific analysis. References follow APA 7th edition.
Dissertation (in preparation; the entry will be updated after the defense):
Mançano, T. (2026). Inequality in access to tertiary education in Brazil: Household incomes, reforming policies, and the politics of who gets in (1990s–2020s) [Unpublished master’s thesis]. University of São Paulo.
This figure and pipeline:
Mançano, T. (2026, August 9). Income inequality and real income growth by decile (Gini/Palma panel) [Figure and reproducible pipeline]. Open Data Analysis. https://mancano-tales.github.io/open-data-analysis/posts/desigualdade-renda-gini-palma-decil/
In text: (Mançano, 2026) — when citing several analyses from this catalog in the same work, APA distinguishes them as 2026a, 2026b, … in the order they appear in the reference list.
BibTeX:
@mastersthesis{Mancano2026Thesis,
  author = {Man\c{c}ano, Tales},
  title  = {Inequality in Access to Tertiary Education in Brazil: Household
            Incomes, Reforming Policies, and the Politics of Who Gets In
            (1990s--2020s)},
  school = {University of S\~{a}o Paulo},
  year   = {2026},
  type   = {Master's thesis},
  note   = {Unpublished; Graduate Program in Political Science}
}

@misc{Mancano2026_desigualdade_renda_gini_palma_decil,
  author       = {Man\c{c}ano, Tales},
  title        = {Income inequality and real income growth by decile (Gini/Palma panel)},
  year         = {2026},
  month        = aug,
  howpublished = {Open Data Analysis, \url{https://mancano-tales.github.io/open-data-analysis/posts/desigualdade-renda-gini-palma-decil/}},
  note         = {Figure and reproducible pipeline. Source code: \url{https://github.com/mancano-tales/open-data-analysis}, folder posts/desigualdade-renda-gini-palma-decil/. Accessed YYYY-MM-DD}
}
A permanent version (Git tag + Zenodo DOI) will be linked here once the dissertation is defended; until then, cite the page URL above and add the date you accessed it (source code: https://github.com/mancano-tales/open-data-analysis, folder posts/desigualdade-renda-gini-palma-decil/).
Pipeline
This figure draws on the PNAD / PNAD Contínua Harmonization, 1992–2025 panel.
Run these scripts in this order, from the project root (each one writes to data-raw/, which the next one reads):
shared-pipeline/pnadc/000_PNADC_Download_Consolidate.R— downloads PNAD Contínua 2012–2025 (1st interview) withPNADcIBGE::get_pnadc()intodata-raw/pnadc_raw/and consolidates it intodata-raw/pnadc_consolidado_2012_2025_interview1.rdsshared-pipeline/pnadc/020_PNAD_Anual_Manual_Import_2001_2015.R— downloads the PNAD Anual 2001–2015 microdata from the IBGE FTP intodata-raw/pnad_anual_raw/and imports them intodata-raw/harmonizing-br-data/output/PNAD_Anual_2001_2015.parquetshared-pipeline/pnadc/050_PNAD_Historica_Manual_Import_1992_1999.R— same for PNAD Anual 1992–1999 (PNAD_Anual_1992_1999.parquet)shared-pipeline/pnadc/021_PNAD_Anual_Import_Com_Renda_Zero.R— re-imports PNAD Anual 2001–2015 keeping zero-income households (PNAD_Anual_2001_2015_com_zero.parquet), which script 238 needsshared-pipeline/pnadc/035_Splice_Microdados.R— splices PNAD Anual and PNAD Contínua into the harmonized panel —Microdados_Todas_Idades_1992_2025.parquetandMicrodados_Jovens_18_24_1992_2025.parquetindata-raw/harmonizing-br-data/output/(sourcesshared-pipeline/utils/codigos_curso_pnad.R)shared-pipeline/pnadc/238_Serie_Desigualdade_Oficial.R— derives the official income-inequality series (238_serie_desigualdade_oficial.rds). Optional input:PNADC_Visita5_2019_2022.parquet(PNAD Contínua 5th-interview microdata, not built by any script in this repository) grafts the 2020–2021 points; without it those two years are simply absentplot.R— readsMicrodados_Todas_Idades_1992_2025.parquetand238_serie_desigualdade_oficial.rds; writes the figure tooutput/figures/desigualdade-renda-gini-palma-decil/— compare it with this post’sthumbnail.png
All of the upstream steps above are Tier A and are also run, in this same order, by shared-pipeline/build_public_data.R.
Reproducibility
Tier: A
This pipeline uses only public data, accessible via package/API without any credential (PNADcIBGE, censobr, sidrar, ipeadatar). Run the scripts in shared-pipeline/ in numeric order to reconstruct the intermediate data.