Change in Tertiary Education Access Rate by Income Decile and Presidential Term
Overview
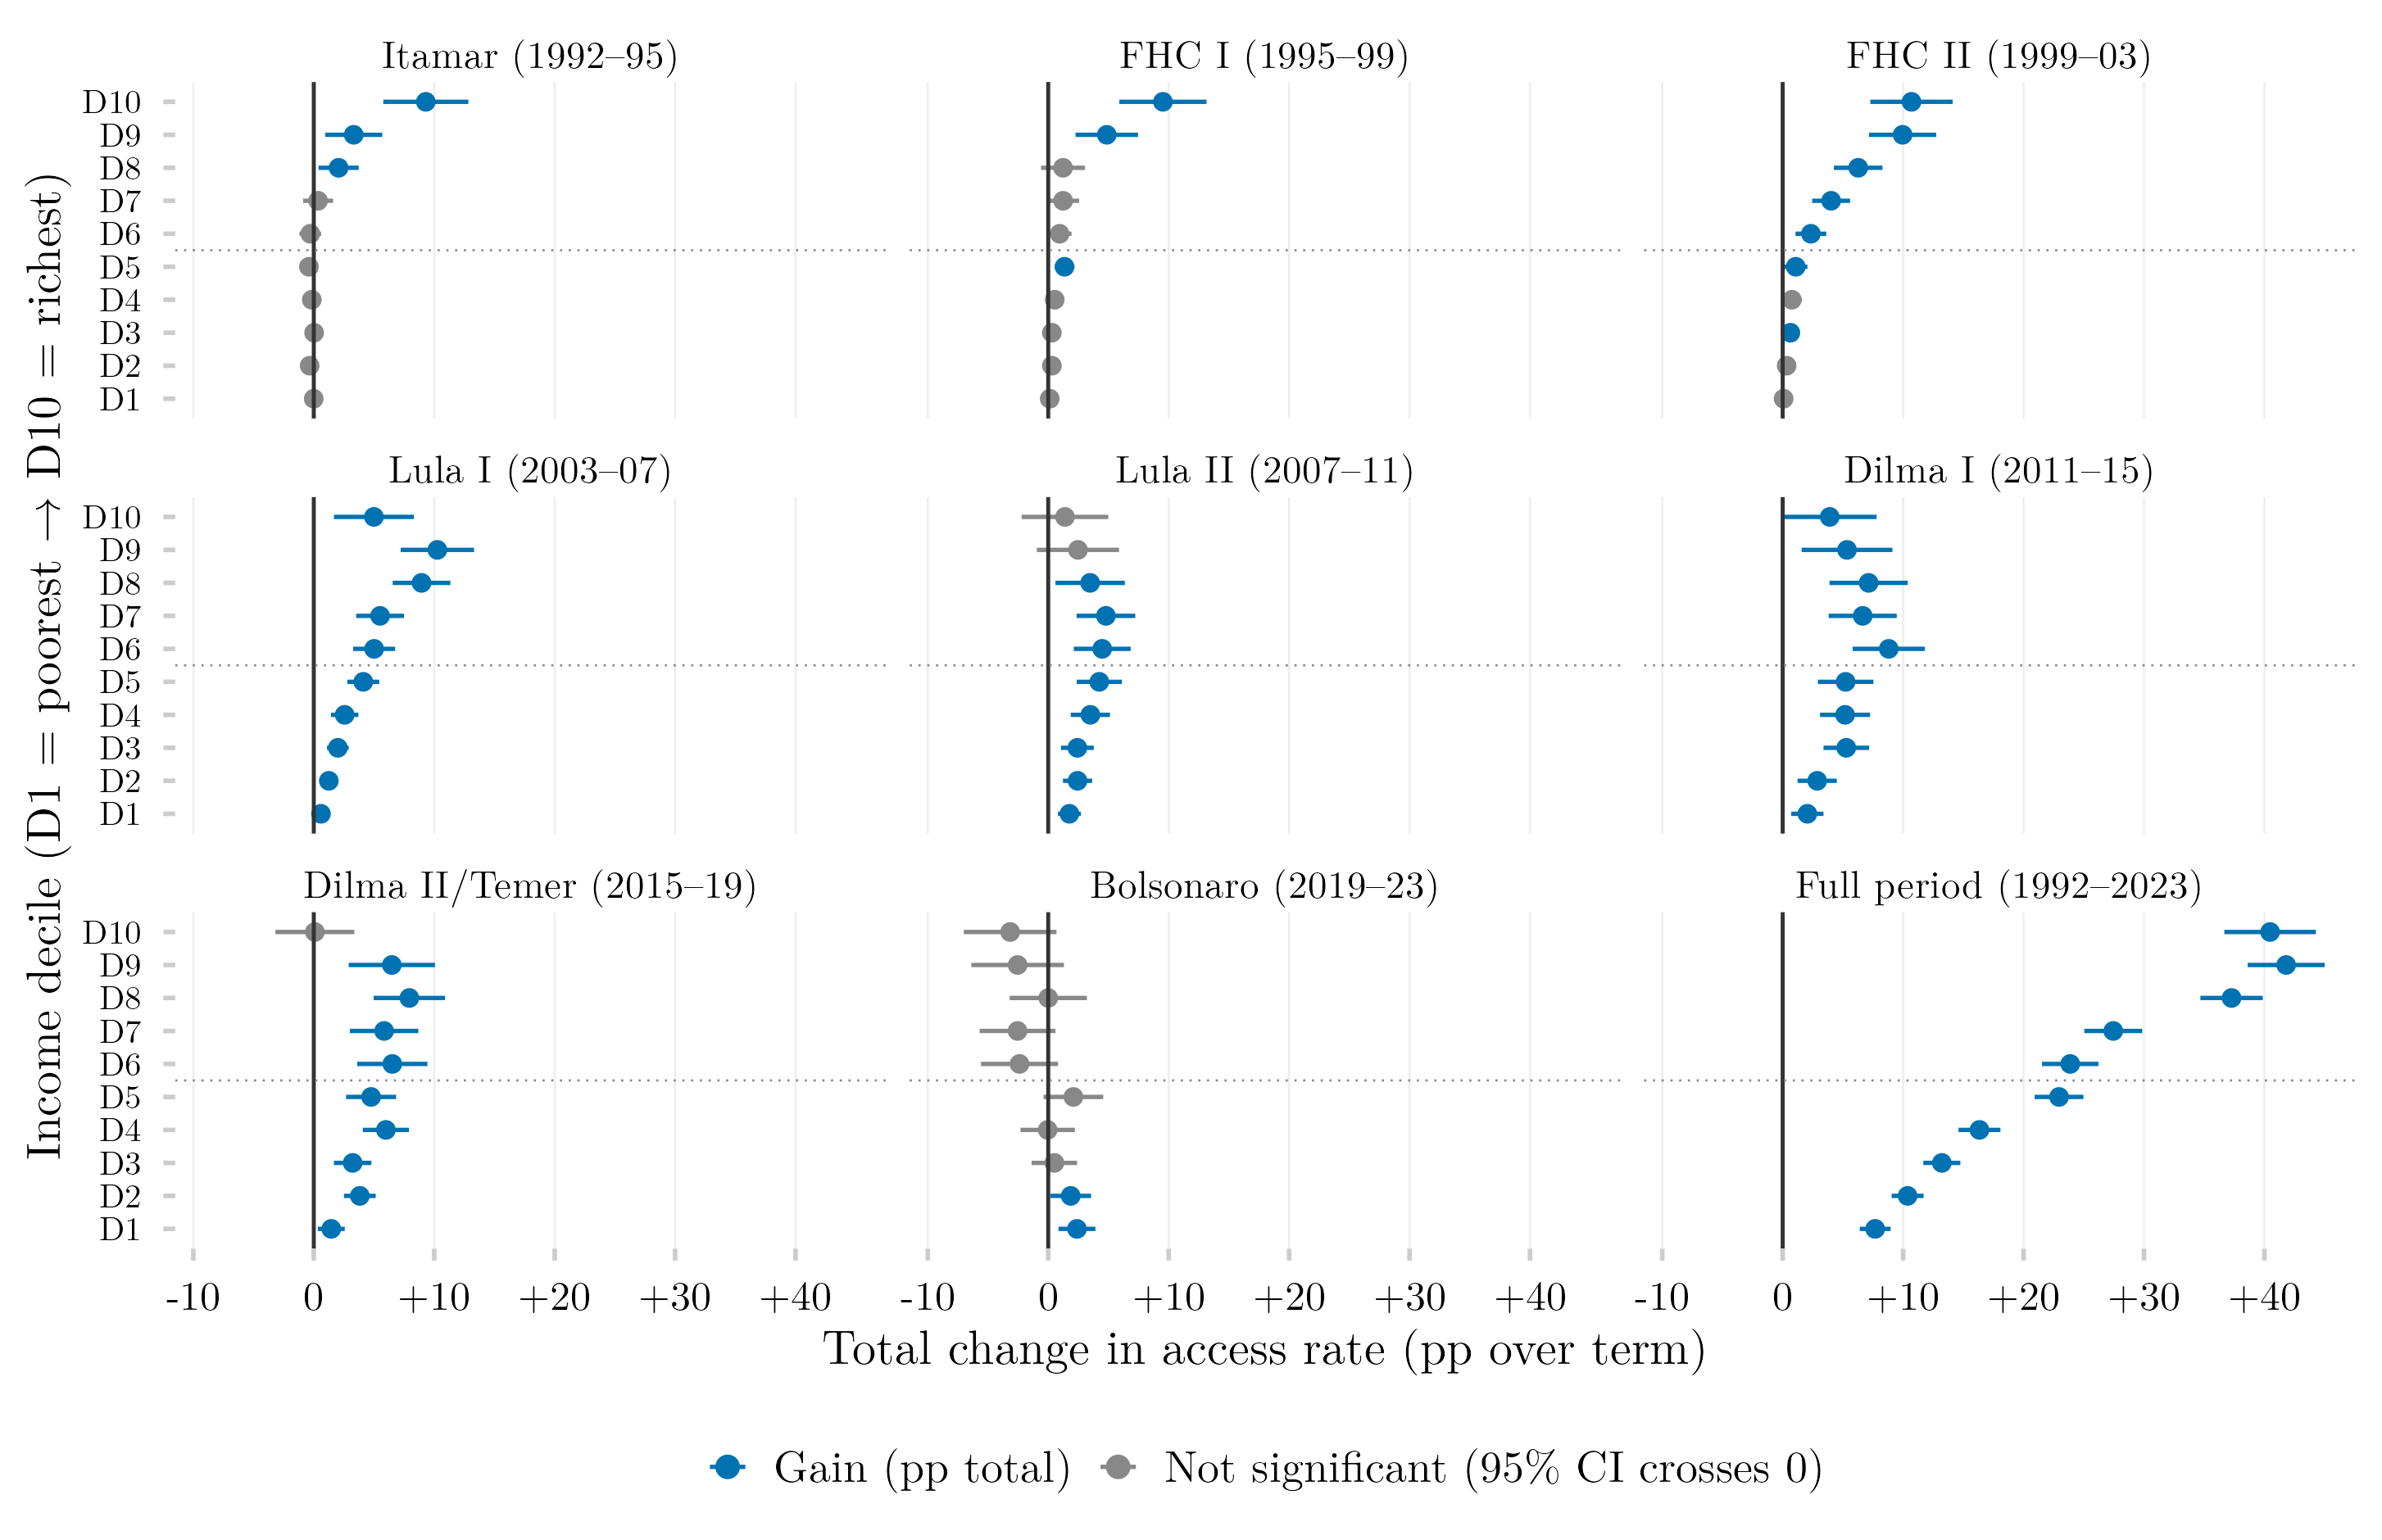
This figure measures how much the share of 18–24-year-olds who had ever accessed tertiary education changed during each Brazilian presidential term, broken down by income decile, using a Cleveland dot-plot layout. Each panel is one term, showing one point per income decile for the total percentage-point change in access from the start to the end of that term. It offers a government-by-government view of who gained or lost ground in access to higher education.
Methodology
Each point shows the total percentage-point change in the share of 18–24-year-olds who had ever accessed tertiary education (ens_sup), from the first year of each presidential term to the first year of the next; horizontal lines are 95% confidence intervals. Color encodes statistical significance rather than sign: a point is grey wherever its interval contains zero. The interval is that of the difference itself, with its standard error taken as the root of the sum of the two years’ squared standard errors, treating the two surveys as independent — the test is therefore conservative. The two source surveys are spliced by presidential term rather than by year: every term panel draws on a single survey at both endpoints, PNAD Anual through 2015 and PNAD Contínua from 2015 onward, so no difference straddles the change of instrument. The full-period panel is the only one that remains cross-survey.
How to Cite
If you use this figure or the pipeline behind it, please cite both the dissertation and this specific analysis. References follow APA 7th edition.
Dissertation (in preparation; the entry will be updated after the defense):
Mançano, T. (2026). Inequality in access to tertiary education in Brazil: Household incomes, reforming policies, and the politics of who gets in (1990s–2020s) [Unpublished master’s thesis]. University of São Paulo.
This figure and pipeline:
Mançano, T. (2026, August 7). Change in tertiary education access rate by income decile and presidential term [Figure and reproducible pipeline]. Open Data Analysis. https://mancano-tales.github.io/open-data-analysis/posts/delta-acesso-decil-governo/
In text: (Mançano, 2026) — when citing several analyses from this catalog in the same work, APA distinguishes them as 2026a, 2026b, … in the order they appear in the reference list.
BibTeX:
@mastersthesis{Mancano2026Thesis,
  author = {Man\c{c}ano, Tales},
  title  = {Inequality in Access to Tertiary Education in Brazil: Household
            Incomes, Reforming Policies, and the Politics of Who Gets In
            (1990s--2020s)},
  school = {University of S\~{a}o Paulo},
  year   = {2026},
  type   = {Master's thesis},
  note   = {Unpublished; Graduate Program in Political Science}
}

@misc{Mancano2026_delta_acesso_decil_governo,
  author       = {Man\c{c}ano, Tales},
  title        = {Change in tertiary education access rate by income decile and presidential term},
  year         = {2026},
  month        = aug,
  howpublished = {Open Data Analysis, \url{https://mancano-tales.github.io/open-data-analysis/posts/delta-acesso-decil-governo/}},
  note         = {Figure and reproducible pipeline. Source code: \url{https://github.com/mancano-tales/open-data-analysis}, folder posts/delta-acesso-decil-governo/. Accessed YYYY-MM-DD}
}
A permanent version (Git tag + Zenodo DOI) will be linked here once the dissertation is defended; until then, cite the page URL above and add the date you accessed it (source code: https://github.com/mancano-tales/open-data-analysis, folder posts/delta-acesso-decil-governo/).
Pipeline
This figure draws on the PNAD / PNAD Contínua Harmonization, 1992–2025 panel.
Run these scripts in this order, from the project root (each one writes to data-raw/, which the next one reads):
shared-pipeline/pnadc/000_PNADC_Download_Consolidate.R— downloads PNAD Contínua 2012–2025 (1st interview) withPNADcIBGE::get_pnadc()intodata-raw/pnadc_raw/and consolidates it intodata-raw/pnadc_consolidado_2012_2025_interview1.rdsshared-pipeline/pnadc/020_PNAD_Anual_Manual_Import_2001_2015.R— downloads the PNAD Anual 2001–2015 microdata from the IBGE FTP intodata-raw/pnad_anual_raw/and imports them intodata-raw/harmonizing-br-data/output/PNAD_Anual_2001_2015.parquetshared-pipeline/pnadc/050_PNAD_Historica_Manual_Import_1992_1999.R— same for PNAD Anual 1992–1999 (PNAD_Anual_1992_1999.parquet)shared-pipeline/pnadc/035_Splice_Microdados.R— splices PNAD Anual and PNAD Contínua into the harmonized panel —Microdados_Todas_Idades_1992_2025.parquetandMicrodados_Jovens_18_24_1992_2025.parquetindata-raw/harmonizing-br-data/output/(sourcesshared-pipeline/utils/codigos_curso_pnad.R)plot.R— readsMicrodados_Jovens_18_24_1992_2025.parquetplusdata-raw/pnadc_consolidado_2012_2025_interview1.rds(survey design variables for the PNAD Contínua years); writes the figure tooutput/figures/delta-acesso-decil-governo/— compare it with this post’sthumbnail.png
All of the upstream steps above are Tier A and are also run, in this same order, by shared-pipeline/build_public_data.R.
Reproducibility
Tier: A
This pipeline uses only public data, accessible via package/API without any credential (PNADcIBGE, censobr, sidrar, ipeadatar). Run the scripts in shared-pipeline/ in numeric order to reconstruct the intermediate data.