Income Composition of Tertiary Education Students (Ages 18–24)
Overview
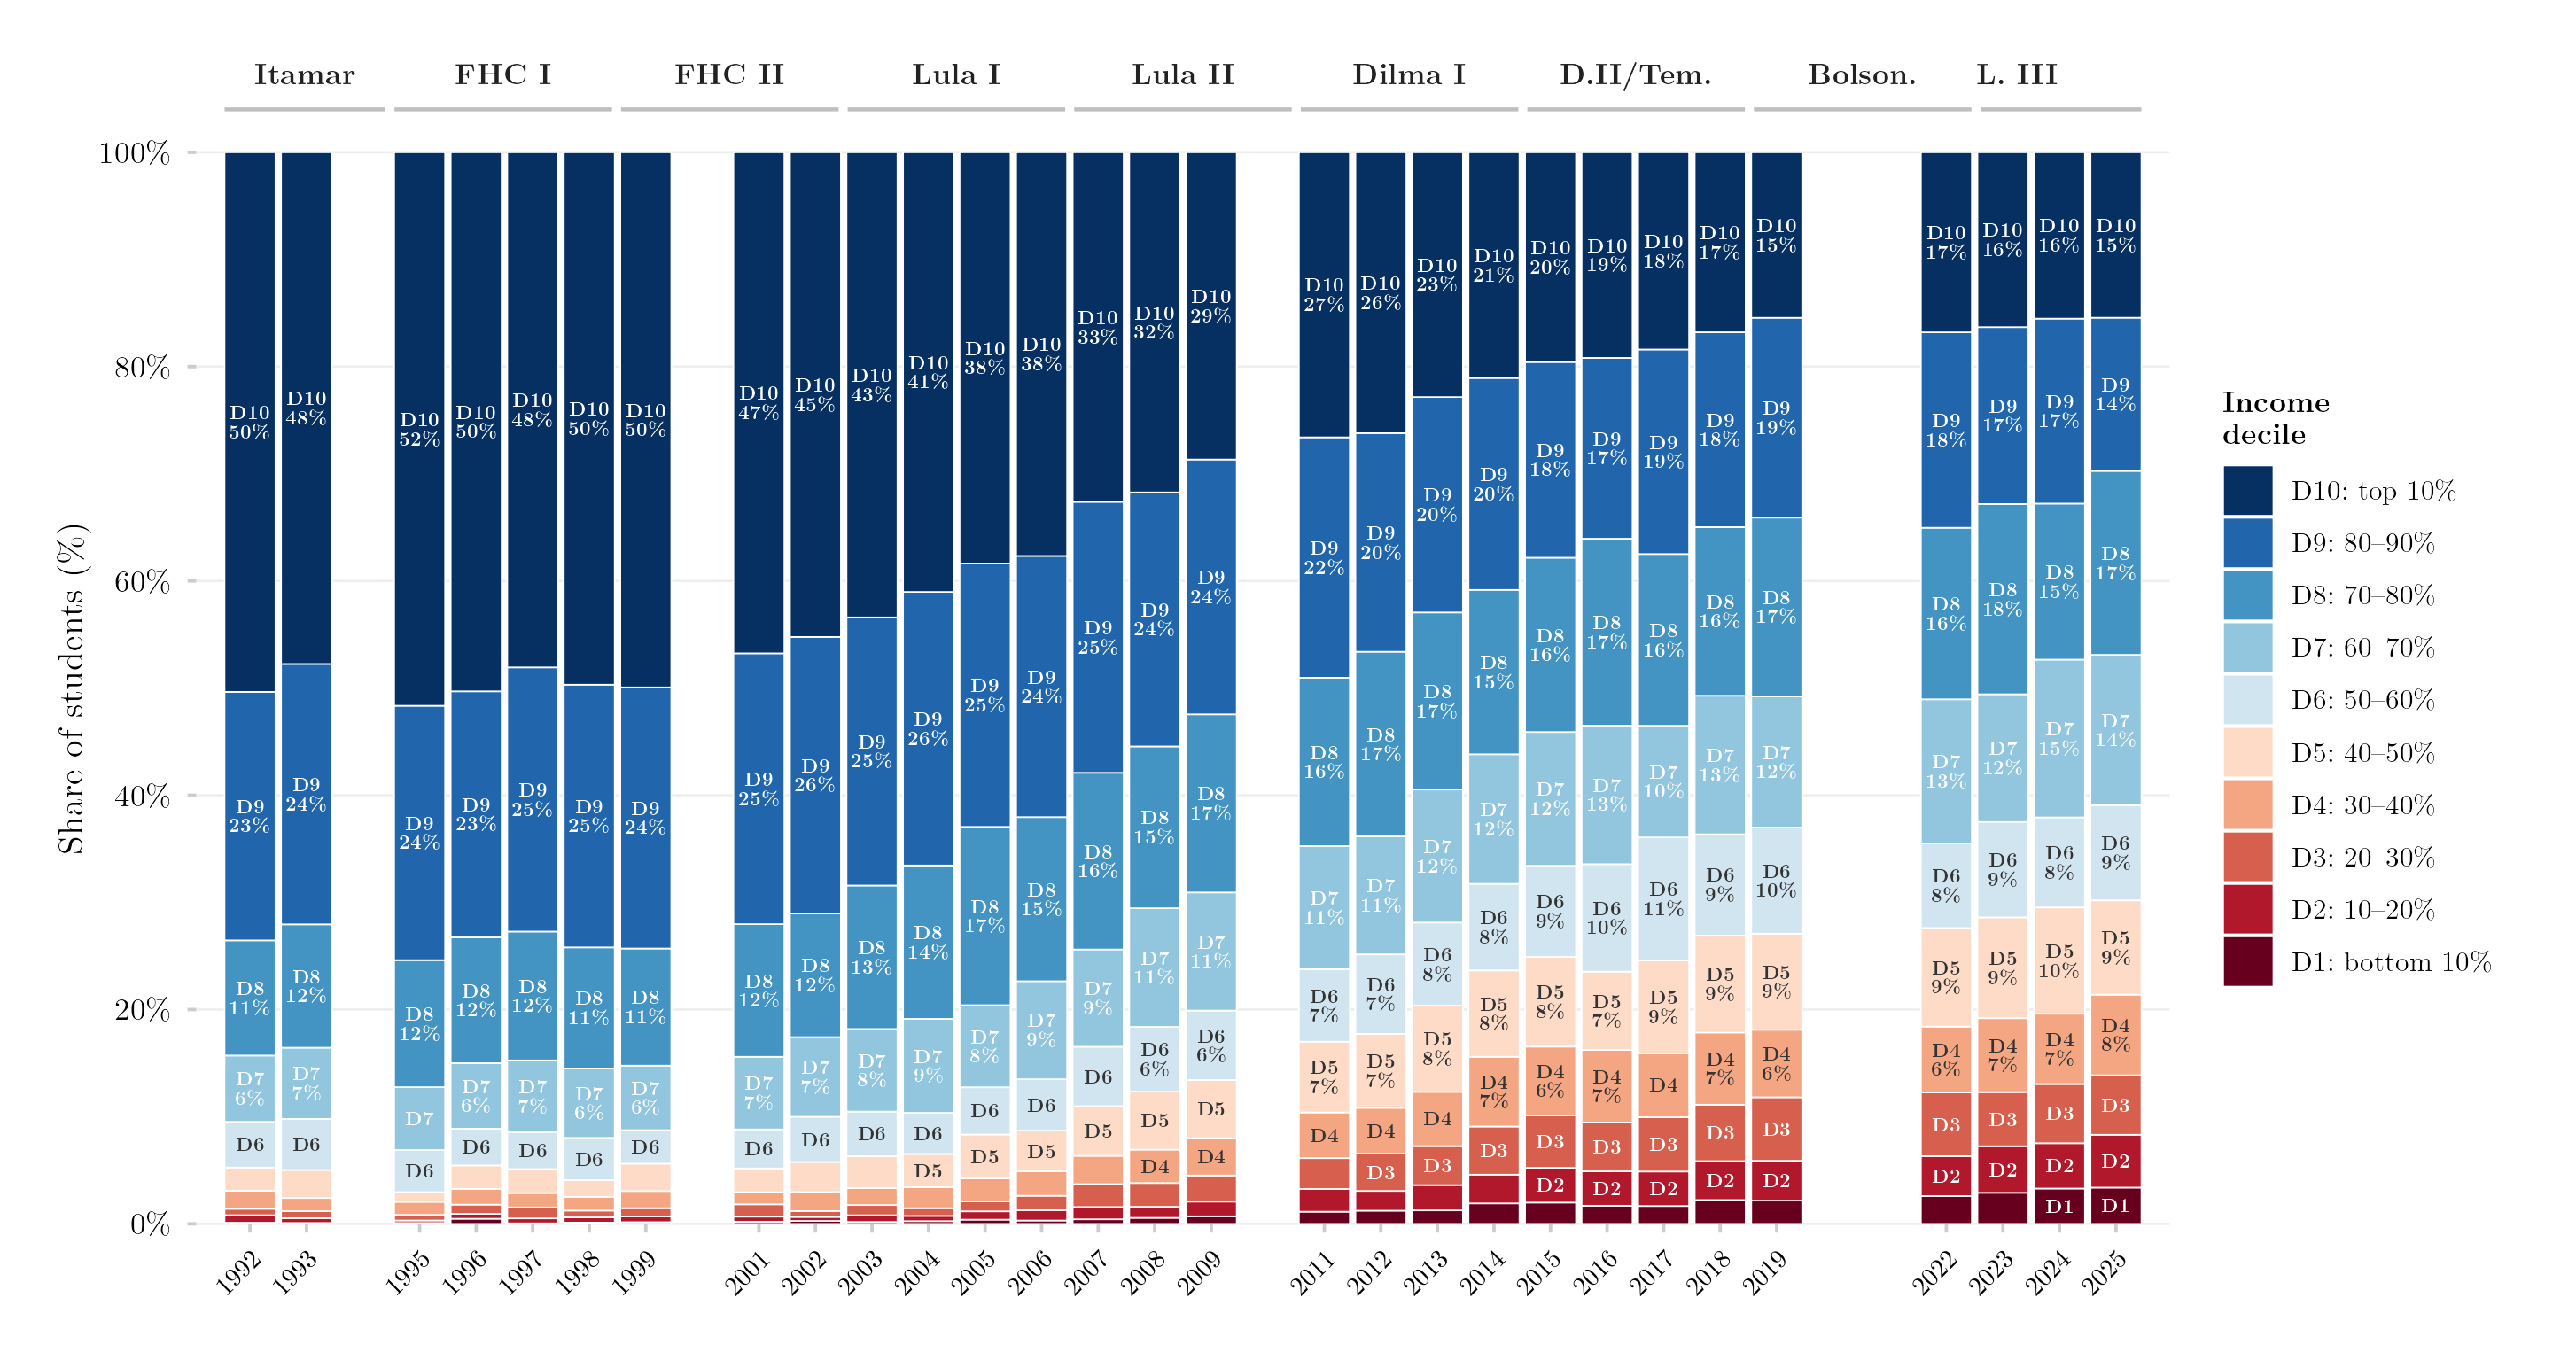
This figure shows how the income composition of Brazil’s tertiary-education students aged 18–24 has changed over time. Each bar is one year, stacked into ten income deciles of the general population (D1 = poorest tenth, D10 = richest tenth); the height of each segment is that decile’s share among students who have ever enrolled in tertiary education. A more even stack — closer to 10% per decile — indicates broader-based access across the income distribution, while segments dominated by upper deciles indicate access concentrated among higher-income households.
Methodology
Each bar shows the share of students aged 18–24 from each income decile. Variable: ens_sup = ever enrolled in tertiary education. Income deciles are the national deciles of the harmonized panel — computed within each survey year and source over the full population with strictly positive income — the same deciles used by the access-rate series, so that a decile denotes the same population in both figures. Because 18–24-year-olds are not evenly spread across national deciles (in 2025, 6.2% of them fall in the top decile and 10.3% in the bottom one), an equal share of students per decile is not the equity benchmark. A version of this figure published before 2026-09-15 ranked the 18–24 sample on its own income distribution instead, which placed 23.3% of 2025 students in “D10” against 15.4% under national deciles. Years 2000 and 2010 are excluded because no PNAD was conducted in Census years; 2020–2021 are excluded because of COVID-19 and the Auxílio Emergencial income transfer, which distorts the income distribution. For 2012–2015, only PNAD Anual observations are used to avoid double-counting the PNAD/PNADC overlap years. Percentage labels are shown for deciles with share ≥ 6%; decile labels only (no percentage) for shares ≥ 3%. Government labels indicate the president in office.
How to Cite
If you use this figure or the pipeline behind it, please cite both the dissertation and this specific analysis. References follow APA 7th edition.
Dissertation (in preparation; the entry will be updated after the defense):
Mançano, T. (2026). Inequality in access to tertiary education in Brazil: Household incomes, reforming policies, and the politics of who gets in (1990s–2020s) [Unpublished master’s thesis]. University of São Paulo.
This figure and pipeline:
Mançano, T. (2026, August 9). Income composition of tertiary education students (ages 18–24) [Figure and reproducible pipeline]. Open Data Analysis. https://mancano-tales.github.io/open-data-analysis/posts/composicao-decil-ens-sup-18-24/
In text: (Mançano, 2026) — when citing several analyses from this catalog in the same work, APA distinguishes them as 2026a, 2026b, … in the order they appear in the reference list.
BibTeX:
@mastersthesis{Mancano2026Thesis,
  author = {Man\c{c}ano, Tales},
  title  = {Inequality in Access to Tertiary Education in Brazil: Household
            Incomes, Reforming Policies, and the Politics of Who Gets In
            (1990s--2020s)},
  school = {University of S\~{a}o Paulo},
  year   = {2026},
  type   = {Master's thesis},
  note   = {Unpublished; Graduate Program in Political Science}
}

@misc{Mancano2026_composicao_decil_ens_sup_18_24,
  author       = {Man\c{c}ano, Tales},
  title        = {Income composition of tertiary education students (ages 18--24)},
  year         = {2026},
  month        = aug,
  howpublished = {Open Data Analysis, \url{https://mancano-tales.github.io/open-data-analysis/posts/composicao-decil-ens-sup-18-24/}},
  note         = {Figure and reproducible pipeline. Source code: \url{https://github.com/mancano-tales/open-data-analysis}, folder posts/composicao-decil-ens-sup-18-24/. Accessed YYYY-MM-DD}
}
A permanent version (Git tag + Zenodo DOI) will be linked here once the dissertation is defended; until then, cite the page URL above and add the date you accessed it (source code: https://github.com/mancano-tales/open-data-analysis, folder posts/composicao-decil-ens-sup-18-24/).
Pipeline
This figure draws on the PNAD / PNAD Contínua Harmonization, 1992–2025 panel.
Run these scripts in this order, from the project root (each one writes to data-raw/, which the next one reads):
shared-pipeline/pnadc/000_PNADC_Download_Consolidate.R— downloads PNAD Contínua 2012–2025 (1st interview) withPNADcIBGE::get_pnadc()intodata-raw/pnadc_raw/and consolidates it intodata-raw/pnadc_consolidado_2012_2025_interview1.rdsshared-pipeline/pnadc/020_PNAD_Anual_Manual_Import_2001_2015.R— downloads the PNAD Anual 2001–2015 microdata from the IBGE FTP intodata-raw/pnad_anual_raw/and imports them intodata-raw/harmonizing-br-data/output/PNAD_Anual_2001_2015.parquetshared-pipeline/pnadc/050_PNAD_Historica_Manual_Import_1992_1999.R— same for PNAD Anual 1992–1999 (PNAD_Anual_1992_1999.parquet)shared-pipeline/pnadc/035_Splice_Microdados.R— splices PNAD Anual and PNAD Contínua into the harmonized panel —Microdados_Todas_Idades_1992_2025.parquetandMicrodados_Jovens_18_24_1992_2025.parquetindata-raw/harmonizing-br-data/output/(sourcesshared-pipeline/utils/codigos_curso_pnad.R)plot.R— readsMicrodados_Jovens_18_24_1992_2025.parquetandMicrodados_Todas_Idades_1992_2025.parquet; writes the figure tooutput/figures/composicao-decil-ens-sup-18-24/— compare it with this post’sthumbnail.png
All of the upstream steps above are Tier A and are also run, in this same order, by shared-pipeline/build_public_data.R.
Reproducibility
Tier: A
This pipeline uses only public data, accessible via package/API without any credential (PNADcIBGE, censobr, sidrar, ipeadatar). Run the scripts in shared-pipeline/ in numeric order to reconstruct the intermediate data.